Estimated Value: $786,000 - $867,215
6
Beds
4
Baths
2,278
Sq Ft
$366/Sq Ft
Est. Value
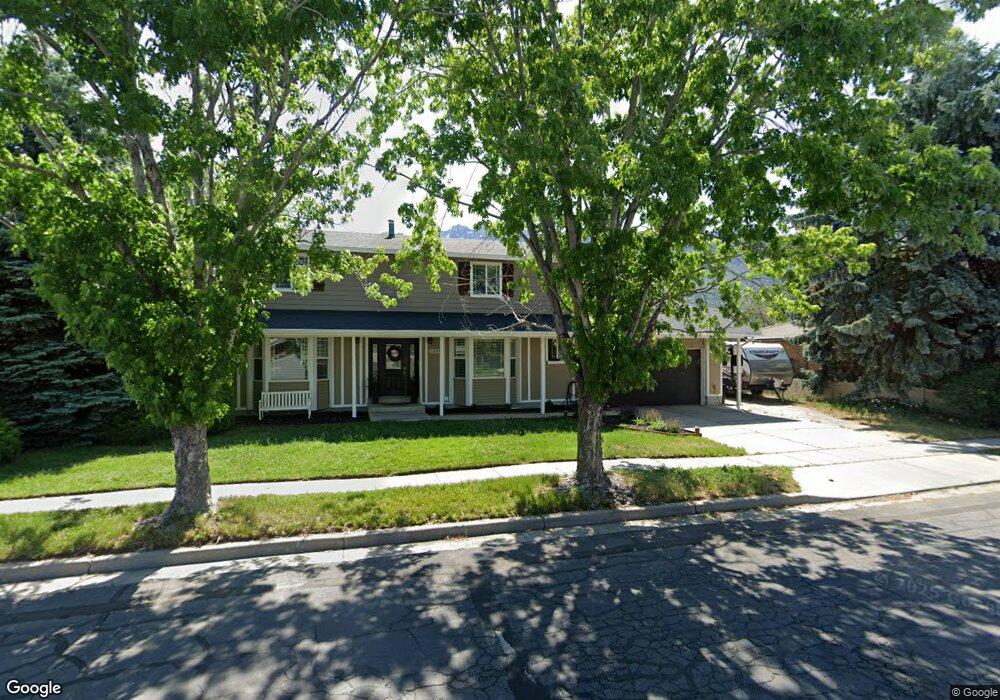
About This Home
This home is located at 11539 Player Rd, Sandy, UT 84092 and is currently estimated at $833,054, approximately $365 per square foot. 11539 Player Rd is a home located in Salt Lake County with nearby schools including Sunrise Elementary School, Bell Canyon Montessori School, and Challenger School - Sandy.
Ownership History
Date
Name
Owned For
Owner Type
Purchase Details
Closed on
Mar 18, 2015
Sold by
Lmp Acquisition Ii Llc
Bought by
Page Matthew and Page Jana
Current Estimated Value
Home Financials for this Owner
Home Financials are based on the most recent Mortgage that was taken out on this home.
Original Mortgage
$335,750
Outstanding Balance
$257,435
Interest Rate
3.71%
Mortgage Type
New Conventional
Estimated Equity
$575,619
Purchase Details
Closed on
Apr 22, 2014
Sold by
33 Holdings Llc
Bought by
Lmp Acquisition Ii Llc
Purchase Details
Closed on
Apr 16, 2014
Sold by
Montrone Ralph Tyler and Montrone Brittany Anne
Bought by
33 Holdings Llc
Purchase Details
Closed on
Sep 8, 2005
Sold by
Walsh Allan O and Walsh Brenda Diane
Bought by
Montrone Ralph Tyler and Montrone Brittany Anne
Home Financials for this Owner
Home Financials are based on the most recent Mortgage that was taken out on this home.
Original Mortgage
$204,000
Interest Rate
5.7%
Mortgage Type
Fannie Mae Freddie Mac
Create a Home Valuation Report for This Property
The Home Valuation Report is an in-depth analysis detailing your home's value as well as a comparison with similar homes in the area
Home Values in the Area
Average Home Value in this Area
Purchase History
| Date | Buyer | Sale Price | Title Company |
|---|---|---|---|
| Page Matthew | -- | Title Guarantee S Jordan | |
| Lmp Acquisition Ii Llc | -- | Accommodation | |
| 33 Holdings Llc | -- | First American Title | |
| Montrone Ralph Tyler | -- | Backman Title Services |
Source: Public Records
Mortgage History
| Date | Status | Borrower | Loan Amount |
|---|---|---|---|
| Open | Page Matthew | $335,750 | |
| Previous Owner | Montrone Ralph Tyler | $204,000 |
Source: Public Records
Tax History
| Year | Tax Paid | Tax Assessment Tax Assessment Total Assessment is a certain percentage of the fair market value that is determined by local assessors to be the total taxable value of land and additions on the property. | Land | Improvement |
|---|---|---|---|---|
| 2025 | $3,965 | $795,500 | $254,800 | $540,700 |
| 2024 | $3,965 | $749,700 | $245,200 | $504,500 |
| 2023 | $3,803 | $718,500 | $235,800 | $482,700 |
| 2022 | $4,027 | $743,700 | $231,200 | $512,500 |
| 2021 | $3,434 | $540,100 | $183,400 | $356,700 |
| 2020 | $3,271 | $485,800 | $183,400 | $302,400 |
| 2019 | $3,306 | $479,200 | $173,100 | $306,100 |
| 2016 | $2,990 | $419,800 | $156,000 | $263,800 |
Source: Public Records
Map
Nearby Homes
- 11341 S Silver Buckle Way
- 1653 Crescent View Dr
- 11343 Clifford Cir
- 11382 S Canyon Falls Ln
- 11318 Canyon Falls Ln
- 11755 S Canberra Dr
- 1320 E Woodhill Cir
- 1234 E Sandy Ridge Dr
- 11855 S Hidden Valley Dr
- 1129 E Sanders Rd
- 1074 E Black Forest Dr
- 1139 Hidden Valley Dr
- 10868 Prescott Dr
- 11779 S Windcroft Ct
- 12182 S Pine Valley Way
- 11202 S 1000 E
- 2192 E High Mesa Dr
- 11129 S 2125 E
- 10889 Granite Dr
- 12161 S Spring Ridge Cir
- 11539 S Player Rd
- 11553 Player Rd
- 11525 S Player Rd
- 11525 Player Rd
- 11546 Jordan Point Dr
- 11530 Jordan Point Dr
- 11548 Player Rd
- 11548 S Player Rd
- 11560 Jordan Point Dr
- 1553 E Owenwood Cir
- 1553 Owenwood Cir
- 11567 Player Rd
- 11514 Jordan Point Dr
- 11511 Player Rd
- 11511 S Player Rd
- 11566 E Player Rd
- 11566 S Player Rd
- 11566 Player Rd
- 1542 Owenwood Cir
- 1542 E Owenwood Cir
Your Personal Tour Guide
Ask me questions while you tour the home.