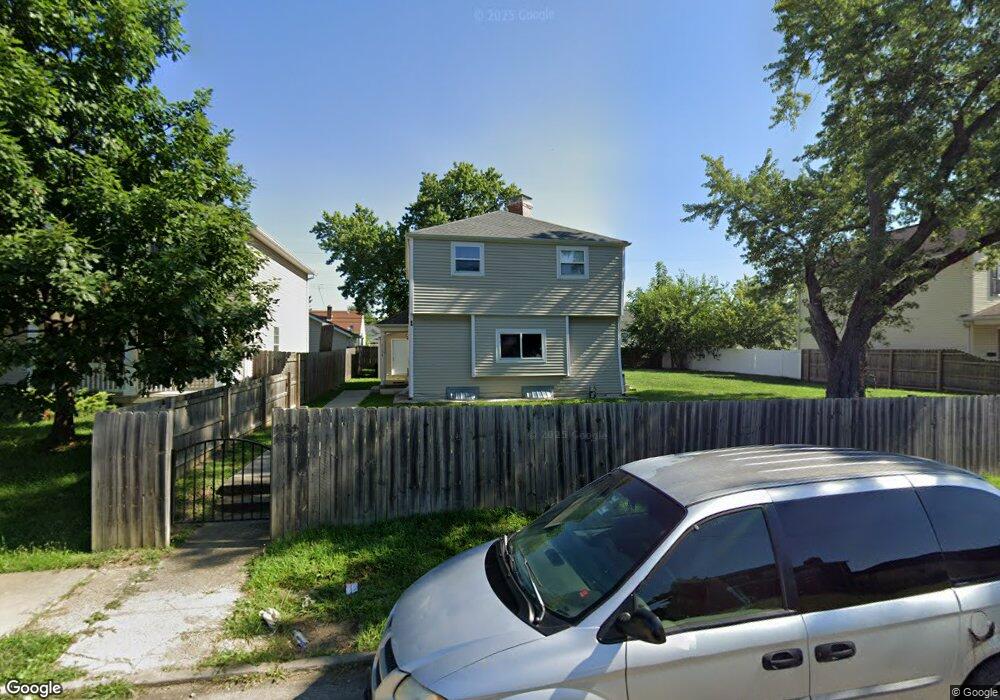
1154 E 23rd Ave Columbus, OH 43211
South Linden NeighborhoodEstimated Value: $168,144 - $278,000
About This Home
This home is located at 1154 E 23rd Ave, Columbus, OH 43211 and is currently estimated at $227,786, approximately $144 per square foot. 1154 E 23rd Ave is a home located in Franklin County with nearby schools including Linden-Mckinley Stem School On Arcadia, North Columbus Preparatory Academy, and Midnimo Cross Cultural Middle School.
Ownership History
We collect this data history from publicly available records. To have your information removed, we recommend requesting removal directly through your county’s website.
Purchase Details
Home Financials for this Owner
Home Financials are based on the most recent Mortgage that was taken out on this home.Purchase Details
Purchase Details
Purchase Details
Purchase Details
Purchase Details
Purchase Details
Purchase Details
Home Financials for this Owner
Home Financials are based on the most recent Mortgage that was taken out on this home.Purchase Details
Home Financials for this Owner
Home Financials are based on the most recent Mortgage that was taken out on this home.Purchase Details
Purchase Details
Home Financials for this Owner
Home Financials are based on the most recent Mortgage that was taken out on this home.Purchase Details
Purchase Details
Purchase Details
Purchase Details
Home Financials for this Owner
Home Financials are based on the most recent Mortgage that was taken out on this home.Purchase Details
Purchase Details
Home Values in the Area
Average Home Value in this Area
Purchase History
We collect this data history from publicly available records. To have your information removed, we recommend requesting removal directly through your county’s website.
| Date | Buyer | Sale Price | Title Company |
|---|---|---|---|
| $190,000 | World Class Title | ||
| $58,000 | Bridge T&E Svcs Llc | ||
| $4,500 | None Available | ||
| $3,000 | None Available | ||
| -- | None Available | ||
| $7,100 | Attorney | ||
| $20,000 | None Available | ||
| $29,900 | 21St Centu | ||
| $12,900 | Resource T | ||
| $24,000 | None Available | ||
| $75,500 | -- | ||
| $40,000 | Esquire Title | ||
| $19,000 | Amerititle Mill Run | ||
| $22,000 | -- | ||
| $66,000 | Hummel Title Agency Inc | ||
| $100,000 | -- | ||
| $30,500 | -- |
Mortgage History
We collect this data history from publicly available records. To have your information removed, we recommend requesting removal directly through your county’s website.
| Date | Status | Borrower | Loan Amount |
|---|---|---|---|
| Open | $181,649 | ||
| Previous Owner | $61,500 | ||
| Previous Owner | $67,500 | ||
| Previous Owner | $59,400 |
Tax History
We collect this data history from publicly available records. To have your information removed, we recommend requesting removal directly through your county’s website.
| Year | Tax Paid | Tax Assessment Tax Assessment Total Assessment is a certain percentage of the fair market value that is determined by local assessors to be the total taxable value of land and additions on the property. | Land | Improvement |
|---|---|---|---|---|
| 2025 | $2,269 | $49,500 | $5,220 | $44,280 |
| 2024 | $2,269 | $49,500 | $5,220 | $44,280 |
| 2023 | $2,240 | $49,490 | $5,215 | $44,275 |
| 2022 | $978 | $18,630 | $2,490 | $16,140 |
| 2021 | $1,149 | $18,630 | $2,490 | $16,140 |
| 2020 | $950 | $18,030 | $2,490 | $15,540 |
| 2019 | $1,112 | $15,020 | $2,070 | $12,950 |
| 2018 | $611 | $10,860 | $2,070 | $8,790 |
| 2017 | $652 | $10,860 | $2,070 | $8,790 |
| 2016 | $3,952 | $3,920 | $2,800 | $1,120 |
| 2015 | $387 | $3,920 | $2,800 | $1,120 |
| 2014 | $243 | $3,920 | $2,800 | $1,120 |
| 2013 | $792 | $4,375 | $3,115 | $1,260 |
Map
- 1129 E 23rd Ave Unit 1129 - 1131
- 1128 E 22nd Ave
- 1107 E 22nd Ave
- 1213 E 25th Ave
- 1900-1904 Hamilton Ave
- 1095 -1097 E 21st Ave
- 1279 E 24th Ave
- 1266 E 22nd Ave
- 1167 Duxberry Ave
- 1048 E 20th Ave
- 1025 E 21st Ave
- 1176 Duxberry Ave
- 1078 E 19th Ave
- 1058 E 26th Ave
- 1303 E 22nd Ave
- 1231 E 20th Ave
- 2152 Gerbert Rd
- 1034 E 19th Ave
- 1335 E 25th Ave Unit 337
- 1133 E 19th Ave
- 1150 E 23rd Ave
- 1154 E 23rd Ave Unit 156
- 1154 E 23rd Ave Unit 56
- 1144 E 23rd Ave
- 1160 E 23rd Ave
- 1138 E 23rd Ave Unit 140
- 1138 E 23rd Ave
- 1166 E 23rd Ave
- 1164 E 23rd Ave
- 1134 E 23rd Ave Unit 4
- 1132 E 23rd Ave Unit 1132/34
- 1132 E 23rd Ave
- 1155 E 24th Ave
- 1155 E 24th Ave Unit A
- 1161 E 24th Ave
- 1151 E 24th Ave
- 1167 E 24th Ave
- 1157 E 23rd Ave
- 1143 E 23rd Ave
- 1145 E 24th Ave
Ask me questions while you tour the home.