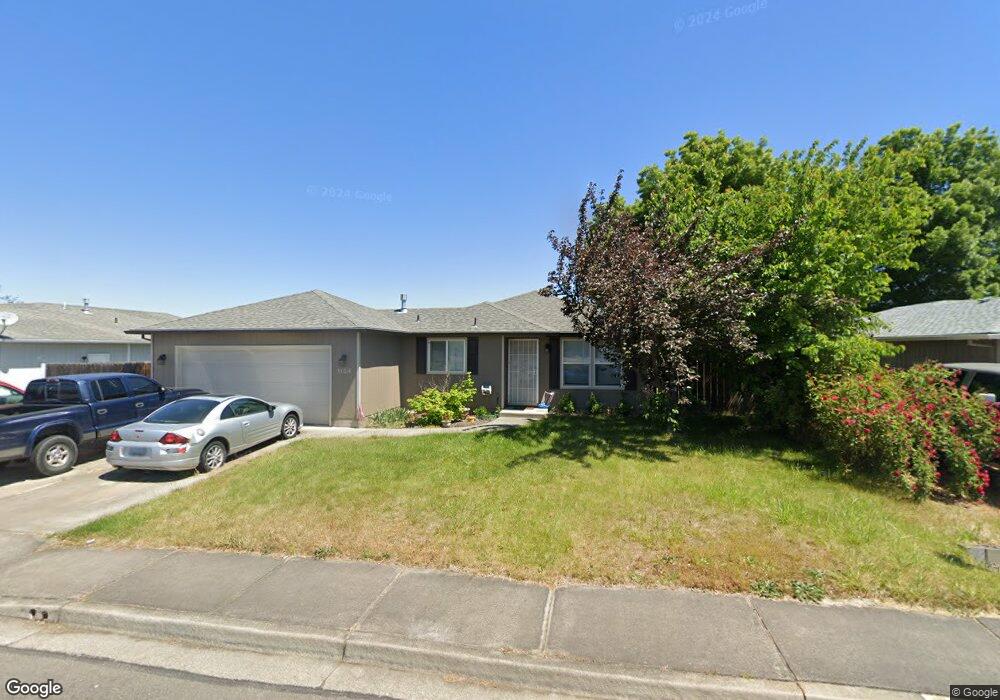
1154 Glengrove Ave Central Point, OR 97502
Estimated Value: $334,000 - $368,000
3
Beds
2
Baths
1,221
Sq Ft
$286/Sq Ft
Est. Value
About This Home
This home is located at 1154 Glengrove Ave, Central Point, OR 97502 and is currently estimated at $348,658, approximately $285 per square foot. 1154 Glengrove Ave is a home located in Jackson County with nearby schools including Central Point Elementary School, Scenic Middle School, and Crater High School.
Ownership History
Date
Name
Owned For
Owner Type
Purchase Details
Closed on
May 8, 2003
Sold by
Huxtable Rachell and Huxtable Richard
Bought by
Penner Robert A and Penner Heather A
Current Estimated Value
Home Financials for this Owner
Home Financials are based on the most recent Mortgage that was taken out on this home.
Original Mortgage
$142,000
Outstanding Balance
$61,356
Interest Rate
5.71%
Estimated Equity
$287,302
Purchase Details
Closed on
Apr 7, 2000
Sold by
Chesney Sandra G
Bought by
White Rachell and Huxtable Ritchard
Home Financials for this Owner
Home Financials are based on the most recent Mortgage that was taken out on this home.
Original Mortgage
$96,000
Interest Rate
9.25%
Purchase Details
Closed on
Apr 8, 1999
Sold by
Whittle Gary T and Whittle Construction
Bought by
Chesney Sandra G
Home Financials for this Owner
Home Financials are based on the most recent Mortgage that was taken out on this home.
Original Mortgage
$105,000
Interest Rate
6.91%
Mortgage Type
VA
Create a Home Valuation Report for This Property
The Home Valuation Report is an in-depth analysis detailing your home's value as well as a comparison with similar homes in the area
Home Values in the Area
Average Home Value in this Area
Purchase History
| Date | Buyer | Sale Price | Title Company |
|---|---|---|---|
| Penner Robert A | $149,500 | Amerititle | |
| White Rachell | $120,000 | Amerititle | |
| Chesney Sandra G | $105,000 | Amerititle |
Source: Public Records
Mortgage History
| Date | Status | Borrower | Loan Amount |
|---|---|---|---|
| Open | Penner Robert A | $142,000 | |
| Previous Owner | White Rachell | $96,000 | |
| Previous Owner | Chesney Sandra G | $105,000 | |
| Closed | White Rachell | $24,000 |
Source: Public Records
Tax History Compared to Growth
Tax History
| Year | Tax Paid | Tax Assessment Tax Assessment Total Assessment is a certain percentage of the fair market value that is determined by local assessors to be the total taxable value of land and additions on the property. | Land | Improvement |
|---|---|---|---|---|
| 2025 | $2,950 | $177,450 | $45,310 | $132,140 |
| 2024 | $2,950 | $172,290 | $43,990 | $128,300 |
| 2023 | $2,856 | $167,280 | $42,710 | $124,570 |
| 2022 | $2,789 | $167,280 | $42,710 | $124,570 |
| 2021 | $2,709 | $162,410 | $41,460 | $120,950 |
| 2020 | $2,630 | $157,680 | $40,250 | $117,430 |
| 2019 | $2,565 | $148,640 | $37,940 | $110,700 |
| 2018 | $2,487 | $144,320 | $36,840 | $107,480 |
| 2017 | $2,425 | $144,320 | $36,840 | $107,480 |
| 2016 | $2,354 | $136,040 | $34,730 | $101,310 |
| 2015 | $2,221 | $136,040 | $34,730 | $101,310 |
| 2014 | $2,106 | $128,240 | $32,740 | $95,500 |
Source: Public Records
Map
Nearby Homes
- 1025 Fairfield Ave
- 1017 Fairfield Ave
- 1060 Hopkins Rd
- 928 Brandi Way
- 921 Pittview Ave
- 460 Federal Way
- 881 Westrop Dr
- 3119 Merriman Rd
- 851 Juanita Way
- 571 Briarwood Dr
- 811 O'Hare Pkwy
- 3496 Edella St
- 659 Herman Ave
- 745 Herman Ave
- 4121 Table Rock Rd
- 1065 Edwina Ave
- 4105 Table Rock Rd
- 1840 E Pine St
- 4601 Biddle Rd Unit C
- 230 Peninger Rd
- 1158 Glengrove Ave
- 1150 Glengrove Ave
- 0 Glengrove Ave
- 1162 Glengrove Ave
- 1146 Glengrove Ave Unit 5
- 1159 Glengrove Ave
- 1164 Glengrove Ave
- 1143 Glengrove Ave
- 1145 Wedgewood Dr
- 1142 Glengrove Ave
- 1161 Glengrove Ave
- 1151 Wedgewood Dr
- 1166 Glengrove Ave
- 1163 Glengrove Ave
- 1157 Wedgewood Dr
- 1111 Angela Ct
- 1167 Glengrove Ave
- 1168 Glengrove Ave
- 1158 White Chapel Dr
- 1138 White Chapel Dr