1154 S 1850 E Spanish Fork, UT 84660
Estimated Value: $516,000 - $545,000
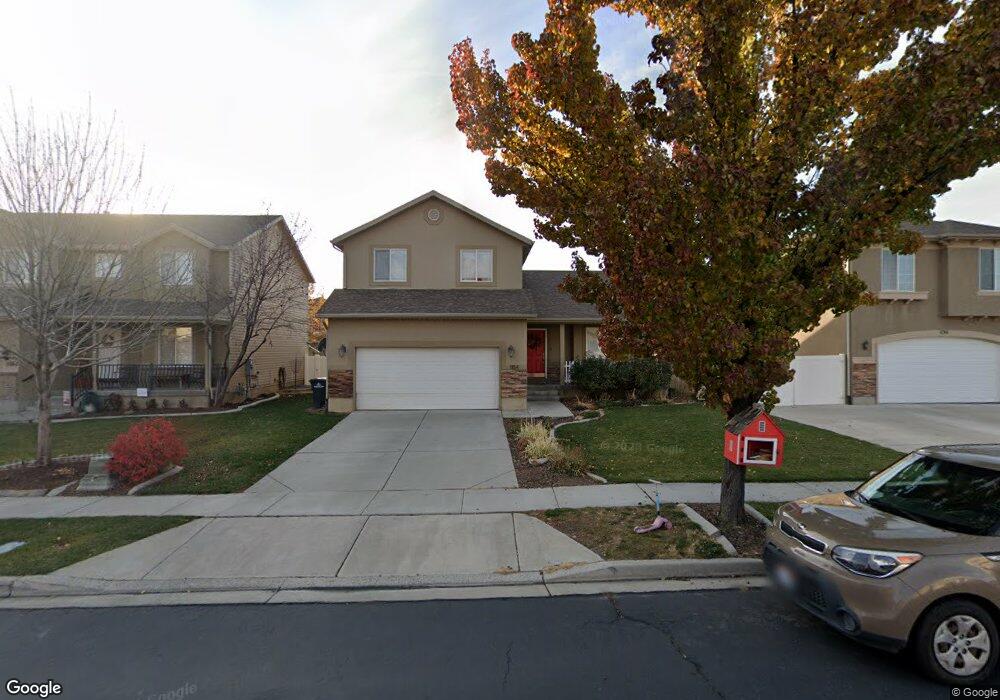
About This Home
This home is located at 1154 S 1850 E, Spanish Fork, UT 84660 and is currently estimated at $533,496, approximately $204 per square foot. 1154 S 1850 E is a home located in Utah County with nearby schools including East Meadows Elementary School, Spanish Fork Jr High School, and Spanish Fork High School.
Ownership History
We collect this data history from publicly available records. To have your information removed, we recommend requesting removal directly through your county’s website.
Purchase Details
Home Financials for this Owner
Home Financials are based on the most recent Mortgage that was taken out on this home.Purchase Details
Home Financials for this Owner
Home Financials are based on the most recent Mortgage that was taken out on this home.Home Values in the Area
Average Home Value in this Area
Purchase History
We collect this data history from publicly available records. To have your information removed, we recommend requesting removal directly through your county’s website.
| Date | Buyer | Sale Price | Title Company |
|---|---|---|---|
| -- | Gt Title Services | ||
| -- | Affiliated First Title Comp |
Mortgage History
We collect this data history from publicly available records. To have your information removed, we recommend requesting removal directly through your county’s website.
| Date | Status | Borrower | Loan Amount |
|---|---|---|---|
| Open | $198,000 | ||
| Previous Owner | $23,000 | ||
| Previous Owner | $184,200 |
Tax History
We collect this data history from publicly available records. To have your information removed, we recommend requesting removal directly through your county’s website.
| Year | Tax Paid | Tax Assessment Tax Assessment Total Assessment is a certain percentage of the fair market value that is determined by local assessors to be the total taxable value of land and additions on the property. | Land | Improvement |
|---|---|---|---|---|
| 2025 | $2,265 | $247,335 | -- | -- |
| 2024 | $2,265 | $233,475 | $0 | $0 |
| 2023 | $2,334 | $240,790 | $0 | $0 |
| 2022 | $2,403 | $243,210 | $0 | $0 |
| 2021 | $2,065 | $334,400 | $105,200 | $229,200 |
| 2020 | $1,955 | $307,800 | $95,600 | $212,200 |
| 2019 | $1,752 | $290,100 | $79,700 | $210,400 |
| 2018 | $1,696 | $271,500 | $75,200 | $196,300 |
| 2017 | $1,587 | $136,565 | $0 | $0 |
| 2016 | $1,503 | $127,600 | $0 | $0 |
| 2015 | $1,403 | $117,700 | $0 | $0 |
| 2014 | $1,280 | $107,800 | $0 | $0 |
Map
- 1794 E 1050 S
- 938 S 1740 E
- 357 E 1460 S Unit 45
- 385 E 1460 S Unit 47
- 2163 E 1400 S
- 1061 S 2230 E
- 2034 E 800 S
- 1439 S 3600 E
- 1517 E 1410 S
- 2037 E 800 S
- 1389 E 1240 S
- 2346 E 1370 S
- 2308 E 830 S Unit 16
- 2308 E 830 S Unit 21
- 2342 E 830 S Unit 27
- 2342 E 830 S Unit 26
- 1332 E 1670 S Unit 823
- 1173 S 1180 E
- 816 S 1300 E
- 1025 S 3100 E Unit 320
Ask me questions while you tour the home.