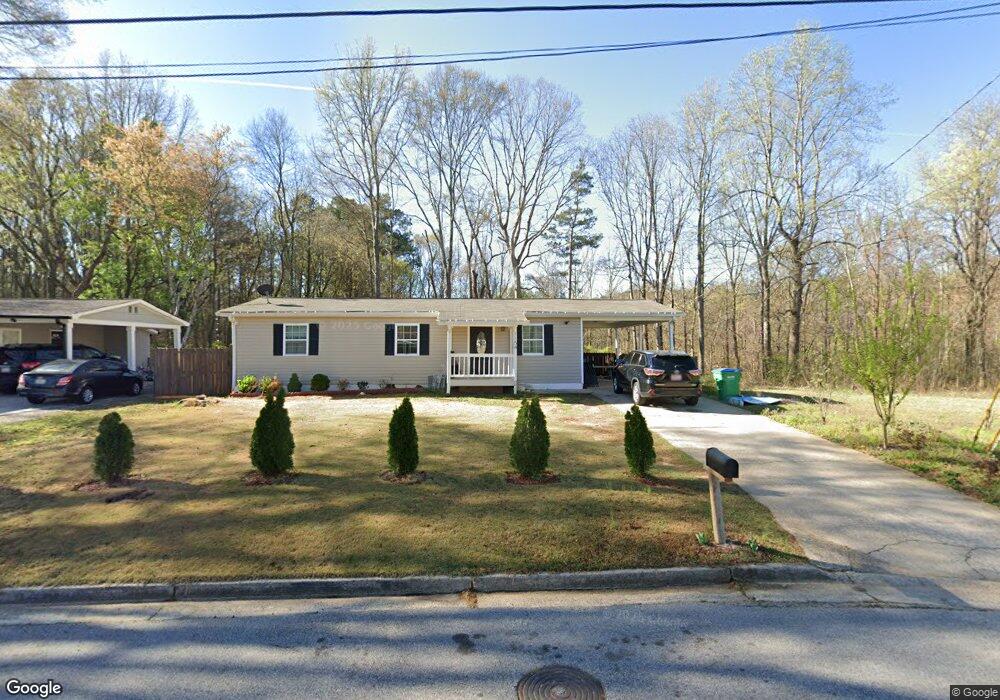
1154 SE Pontiac Circle Se 0 Austell, GA 30168
Estimated Value: $259,000 - $292,522
3
Beds
2
Baths
1,120
Sq Ft
$244/Sq Ft
Est. Value
About This Home
This home is located at 1154 SE Pontiac Circle Se 0, Austell, GA 30168 and is currently estimated at $273,131, approximately $243 per square foot. 1154 SE Pontiac Circle Se 0 is a home located in Cobb County with nearby schools including Austell Elementary School, Garrett Middle School, and DELTA STEAM Academy.
Ownership History
Date
Name
Owned For
Owner Type
Purchase Details
Closed on
Aug 28, 2020
Sold by
Alvarado Juan S
Bought by
Alvarado Juan S and Alvarado Maria C
Current Estimated Value
Home Financials for this Owner
Home Financials are based on the most recent Mortgage that was taken out on this home.
Original Mortgage
$171,830
Outstanding Balance
$152,141
Interest Rate
2.9%
Mortgage Type
New Conventional
Estimated Equity
$120,990
Purchase Details
Closed on
Oct 16, 2017
Sold by
King Deborah A
Bought by
Dekings Properties Llc
Purchase Details
Closed on
Mar 28, 2005
Sold by
Metcalfe Veronica A and Metcalfe James
Bought by
King Deborah A
Home Financials for this Owner
Home Financials are based on the most recent Mortgage that was taken out on this home.
Original Mortgage
$78,750
Interest Rate
5.57%
Mortgage Type
New Conventional
Create a Home Valuation Report for This Property
The Home Valuation Report is an in-depth analysis detailing your home's value as well as a comparison with similar homes in the area
Home Values in the Area
Average Home Value in this Area
Purchase History
| Date | Buyer | Sale Price | Title Company |
|---|---|---|---|
| Alvarado Juan S | -- | None Available | |
| Alvarado Juan S | $175,000 | None Available | |
| Dekings Properties Llc | -- | -- | |
| King Deborah A | $87,500 | -- |
Source: Public Records
Mortgage History
| Date | Status | Borrower | Loan Amount |
|---|---|---|---|
| Open | Alvarado Juan S | $171,830 | |
| Previous Owner | King Deborah A | $78,750 |
Source: Public Records
Tax History Compared to Growth
Tax History
| Year | Tax Paid | Tax Assessment Tax Assessment Total Assessment is a certain percentage of the fair market value that is determined by local assessors to be the total taxable value of land and additions on the property. | Land | Improvement |
|---|---|---|---|---|
| 2025 | $2,878 | $105,972 | $20,000 | $85,972 |
| 2024 | $2,878 | $105,972 | $20,000 | $85,972 |
| 2023 | $2,878 | $105,972 | $20,000 | $85,972 |
| 2022 | $1,986 | $72,592 | $14,000 | $58,592 |
| 2021 | $1,851 | $67,316 | $12,400 | $54,916 |
| 2020 | $901 | $32,788 | $11,200 | $21,588 |
| 2019 | $824 | $29,972 | $11,200 | $18,772 |
| 2018 | $654 | $23,780 | $6,400 | $17,380 |
| 2017 | $531 | $20,584 | $5,600 | $14,984 |
| 2016 | $245 | $9,484 | $2,400 | $7,084 |
| 2015 | $250 | $9,484 | $2,400 | $7,084 |
| 2014 | $253 | $9,484 | $0 | $0 |
Source: Public Records
Map
Nearby Homes
- 1138 Pontiac Cir
- 1138 Pontiac Cir Unit 23
- 2414 Old Alabama Rd
- 110 Creekway Dr
- 1340 Elowen Dr
- 2023 Lee Dr
- 1155 Elowen Dr
- 1055 Elowen Dr
- 3007 Creekside Overlook Way
- 2072 Woodbine Cir
- 13 Robin Rd
- 2440 Ravencliff Dr
- 2440 Ravencliff Dr Unit 145
- 2430 Ravencliff Dr
- 2430 Ravencliff Dr Unit 144
- 2420 Ravencliff Dr Unit 143
- 5818 Eastside Dr
- The Norwood II Plan at Sanders Park
- The Greenbrier II Plan at Sanders Park
- The Ellison II Plan at Sanders Park
- 1154 Pontiac Cir
- 1156 Pontiac Cir
- 1156 Pontiac Cir Unit 34
- 1152 Pontiac Cir
- 1150 Pontiac Cir
- 1147 Pontiac Cir
- 1158 Pontiac Cir
- 1149 Pontiac Cir
- 1145 Pontiac Cir
- 1148 Pontiac Cir
- 1143 Pontiac Cir
- 1160 Pontiac Cir
- 1151 Pontiac Cir
- 1322 Cochise Cir
- 1141 Pontiac Cir
- 1201 Hiawatha Ln
- 1162 Pontiac Cir
- 1324 Cochise Cir
- 1320 Cochise Cir
- 1139 Pontiac Cir