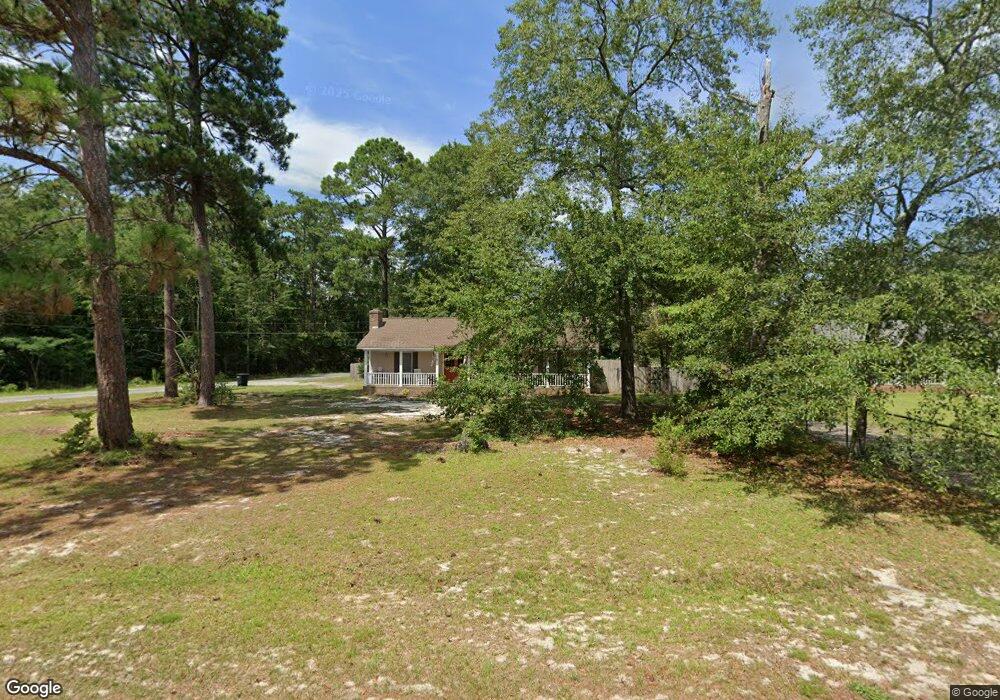
1154 Spring Rd Lugoff, SC 29078
Estimated Value: $209,000 - $254,555
3
Beds
2
Baths
1,421
Sq Ft
$165/Sq Ft
Est. Value
About This Home
This home is located at 1154 Spring Rd, Lugoff, SC 29078 and is currently estimated at $234,889, approximately $165 per square foot. 1154 Spring Rd is a home located in Kershaw County with nearby schools including Lugoff Elementary School, Lugoff-Elgin Middle School, and Lugoff-Elgin High School.
Ownership History
Date
Name
Owned For
Owner Type
Purchase Details
Closed on
Jul 16, 2024
Sold by
Horton Ellen Maria
Bought by
Pratt Lauren Sophia and Pratt Christian Kilman
Current Estimated Value
Home Financials for this Owner
Home Financials are based on the most recent Mortgage that was taken out on this home.
Original Mortgage
$230,000
Outstanding Balance
$226,245
Interest Rate
7.03%
Mortgage Type
New Conventional
Estimated Equity
$8,644
Purchase Details
Closed on
Aug 18, 2020
Sold by
Jenkinson Rebecca B
Bought by
Horton Ellen Maria
Home Financials for this Owner
Home Financials are based on the most recent Mortgage that was taken out on this home.
Original Mortgage
$157,102
Interest Rate
3%
Mortgage Type
FHA
Purchase Details
Closed on
Jul 22, 1996
Sold by
Lance Wayne M and Lance Debbie R
Bought by
Jenkinson Rebecca B
Create a Home Valuation Report for This Property
The Home Valuation Report is an in-depth analysis detailing your home's value as well as a comparison with similar homes in the area
Purchase History
| Date | Buyer | Sale Price | Title Company |
|---|---|---|---|
| Pratt Lauren Sophia | $230,000 | None Listed On Document | |
| Horton Ellen Maria | $160,000 | Vantage Point Title | |
| Jenkinson Rebecca B | $75,500 | -- |
Source: Public Records
Mortgage History
| Date | Status | Borrower | Loan Amount |
|---|---|---|---|
| Open | Pratt Lauren Sophia | $230,000 | |
| Previous Owner | Horton Ellen Maria | $157,102 |
Source: Public Records
Tax History
| Year | Tax Paid | Tax Assessment Tax Assessment Total Assessment is a certain percentage of the fair market value that is determined by local assessors to be the total taxable value of land and additions on the property. | Land | Improvement |
|---|---|---|---|---|
| 2025 | $1,188 | $230,000 | $12,000 | $218,000 |
| 2024 | $1,188 | $230,000 | $12,000 | $218,000 |
| 2023 | $1,194 | $160,200 | $12,000 | $148,200 |
| 2022 | $1,152 | $160,200 | $12,000 | $148,200 |
| 2021 | $1,074 | $160,200 | $12,000 | $148,200 |
| 2020 | $750 | $105,000 | $12,000 | $93,000 |
| 2019 | $772 | $105,000 | $12,000 | $93,000 |
| 2018 | $753 | $105,000 | $12,000 | $93,000 |
| 2017 | $730 | $105,000 | $12,000 | $93,000 |
| 2016 | $705 | $102,200 | $12,000 | $90,200 |
| 2015 | $504 | $102,200 | $12,000 | $90,200 |
| 2014 | $504 | $4,088 | $0 | $0 |
Source: Public Records
Map
Nearby Homes
- 1127 Bayview Dr
- 1035 Rampart Ct
- 106 Lakewood Dr
- 1124 Brock Cir
- 21 Heatherwood Dr
- 1148 Hwy1 S
- 99 Horatio Ln
- 103 Horatio Ln
- 95 Horatio Ln
- 91 Horatio Ln
- 104 Horatio Ln
- 96 Horatio Ln
- 92 Horatio Ln
- 1023 Rampart Ct
- 1031 Rampart Ct
- 1026 Rampart Ct
- 1018 Rampart Ct
- 1042 Rampart Ct
- 1034 Rampart Ct
- 1027 Rampart Ct
- 1148 Spring Rd
- 1144 Spring Rd
- 1133 Bayview Dr
- 120 2nd Ave
- 1147 Spring Rd
- 1141 Spring Rd
- 1139 Bayview Dr
- 1138 Spring Rd
- 1137 Spring Rd
- 1123 Bayview Dr
- 1136 State Road S-28-900
- 125 2nd Ave
- 1145 Bayview Dr
- 128 2nd Ave
- 1132 Spring Rd
- 90A Truesdell Ave
- 1157 Bayview Dr
- 1121 Bayview Dr
- 1128 Bayview Dr
- 1144 Bayview Dr
Your Personal Tour Guide
Ask me questions while you tour the home.