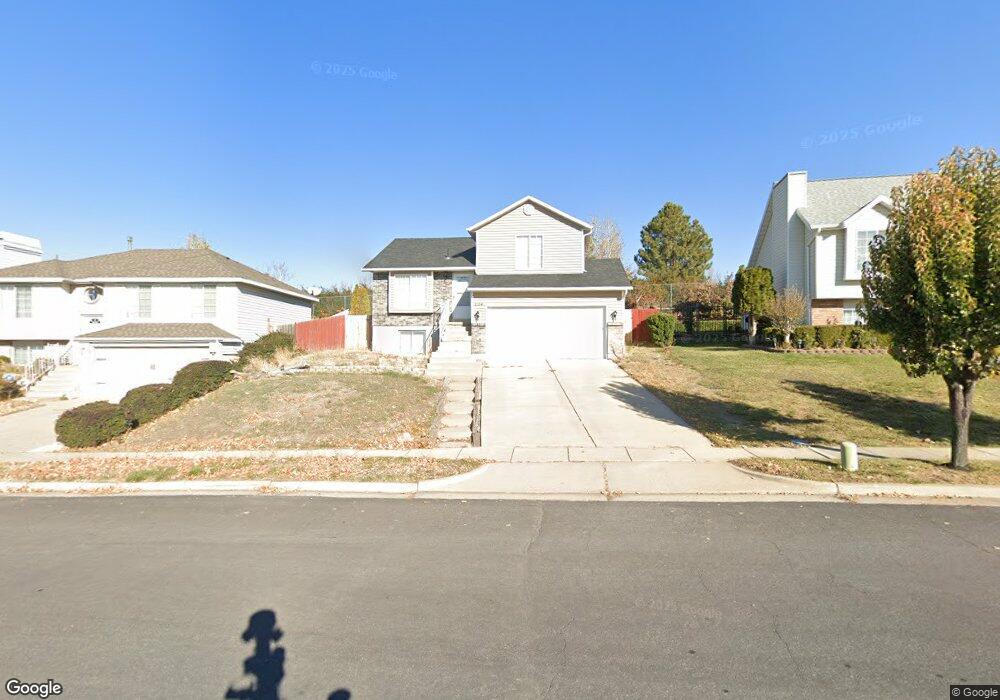
1154 W 2600 N Layton, UT 84041
Estimated Value: $404,000 - $447,000
3
Beds
2
Baths
1,565
Sq Ft
$273/Sq Ft
Est. Value
About This Home
This home is located at 1154 W 2600 N, Layton, UT 84041 and is currently estimated at $427,094, approximately $272 per square foot. 1154 W 2600 N is a home located in Davis County with nearby schools including Lincoln Elementary School, North Layton Junior High School, and Northridge High School.
Ownership History
Date
Name
Owned For
Owner Type
Purchase Details
Closed on
Nov 24, 2004
Sold by
Hansen Evelyn K
Bought by
Kinnes James C
Current Estimated Value
Home Financials for this Owner
Home Financials are based on the most recent Mortgage that was taken out on this home.
Original Mortgage
$115,650
Outstanding Balance
$57,879
Interest Rate
5.72%
Mortgage Type
Purchase Money Mortgage
Estimated Equity
$369,215
Purchase Details
Closed on
Apr 13, 2001
Sold by
Brenchley Matthew L and Brenchley Suzanne F
Bought by
Hansen Evelyn K
Home Financials for this Owner
Home Financials are based on the most recent Mortgage that was taken out on this home.
Original Mortgage
$86,000
Interest Rate
6.98%
Purchase Details
Closed on
Nov 27, 1996
Sold by
Pino Kevin John and Pino Barbara L
Bought by
Brenchley Matthew L and Brenchley Suzanne F
Home Financials for this Owner
Home Financials are based on the most recent Mortgage that was taken out on this home.
Original Mortgage
$104,449
Interest Rate
7.91%
Mortgage Type
FHA
Create a Home Valuation Report for This Property
The Home Valuation Report is an in-depth analysis detailing your home's value as well as a comparison with similar homes in the area
Home Values in the Area
Average Home Value in this Area
Purchase History
| Date | Buyer | Sale Price | Title Company |
|---|---|---|---|
| Kinnes James C | -- | Mountain View Title & Escrow | |
| Hansen Evelyn K | -- | First American Title Co | |
| Brenchley Matthew L | -- | First American Title Co |
Source: Public Records
Mortgage History
| Date | Status | Borrower | Loan Amount |
|---|---|---|---|
| Open | Kinnes James C | $115,650 | |
| Previous Owner | Hansen Evelyn K | $86,000 | |
| Previous Owner | Brenchley Matthew L | $104,449 |
Source: Public Records
Tax History Compared to Growth
Tax History
| Year | Tax Paid | Tax Assessment Tax Assessment Total Assessment is a certain percentage of the fair market value that is determined by local assessors to be the total taxable value of land and additions on the property. | Land | Improvement |
|---|---|---|---|---|
| 2024 | $1,977 | $209,000 | $99,632 | $109,368 |
| 2023 | $1,969 | $367,000 | $127,651 | $239,349 |
| 2022 | $2,032 | $205,700 | $64,702 | $140,998 |
| 2021 | $1,722 | $260,000 | $83,812 | $176,188 |
| 2020 | $1,540 | $223,000 | $73,386 | $149,614 |
| 2019 | $1,551 | $220,000 | $72,413 | $147,587 |
| 2018 | $1,377 | $196,000 | $72,413 | $123,587 |
| 2016 | $1,292 | $94,875 | $21,250 | $73,625 |
| 2015 | $1,226 | $85,470 | $21,250 | $64,220 |
| 2014 | $1,202 | $85,709 | $21,250 | $64,459 |
| 2013 | -- | $84,286 | $20,680 | $63,606 |
Source: Public Records
Map
Nearby Homes
- 2887 N 1175 W
- 2949 N 1175 W
- 850 S 1650 E Unit D
- 2402 N 725 W
- 1548 E 925 S
- 2378 N 675 W
- 781 W 2150 N
- 709 W Highway 193
- 2211 N 525 W
- 2875 N Hill Field Rd Unit 58
- 2875 N Hill Field Rd Unit 17
- 2875 N Hill Field Rd Unit 62
- 1606 W 1960 N
- 1208 Valhalla Dr
- 2187 N 450 W
- 65 Sunset Dr
- 1665 W 1960 N
- 63 Sunset Dr
- 86 Atherton Way
- 85 Atherton Way