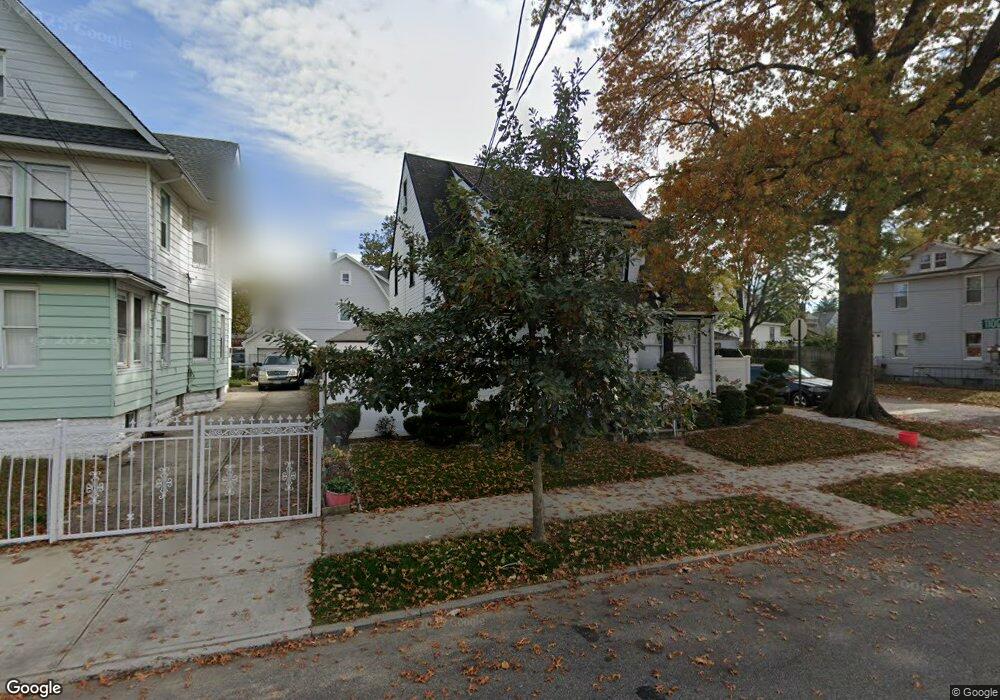
11545 Newburgh St Saint Albans, NY 11412
Saint Albans NeighborhoodEstimated Value: $653,141 - $818,000
--
Bed
--
Bath
1,620
Sq Ft
$454/Sq Ft
Est. Value
About This Home
This home is located at 11545 Newburgh St, Saint Albans, NY 11412 and is currently estimated at $735,535, approximately $454 per square foot. 11545 Newburgh St is a home located in Queens County with nearby schools including Ps 36 St Albans School, Is 59 Springfield Gardens, and Riverton Street Charter School.
Ownership History
Date
Name
Owned For
Owner Type
Purchase Details
Closed on
Sep 17, 1997
Sold by
Exama Roseline
Bought by
Andrews Eric and Andrews Ruth
Current Estimated Value
Home Financials for this Owner
Home Financials are based on the most recent Mortgage that was taken out on this home.
Original Mortgage
$164,550
Outstanding Balance
$25,613
Interest Rate
7.52%
Mortgage Type
FHA
Estimated Equity
$709,922
Create a Home Valuation Report for This Property
The Home Valuation Report is an in-depth analysis detailing your home's value as well as a comparison with similar homes in the area
Home Values in the Area
Average Home Value in this Area
Purchase History
| Date | Buyer | Sale Price | Title Company |
|---|---|---|---|
| Andrews Eric | $166,000 | Commonwealth Land Title Ins |
Source: Public Records
Mortgage History
| Date | Status | Borrower | Loan Amount |
|---|---|---|---|
| Open | Andrews Eric | $164,550 |
Source: Public Records
Tax History Compared to Growth
Tax History
| Year | Tax Paid | Tax Assessment Tax Assessment Total Assessment is a certain percentage of the fair market value that is determined by local assessors to be the total taxable value of land and additions on the property. | Land | Improvement |
|---|---|---|---|---|
| 2025 | $5,427 | $28,423 | $8,765 | $19,658 |
| 2024 | $5,439 | $28,422 | $8,233 | $20,189 |
| 2023 | $5,270 | $27,636 | $8,497 | $19,139 |
| 2022 | $4,919 | $37,980 | $12,600 | $25,380 |
| 2021 | $4,988 | $34,680 | $12,600 | $22,080 |
| 2020 | $4,718 | $29,820 | $12,600 | $17,220 |
| 2019 | $4,662 | $32,640 | $12,600 | $20,040 |
| 2018 | $4,397 | $23,030 | $10,203 | $12,827 |
| 2017 | $4,130 | $21,730 | $9,751 | $11,979 |
| 2016 | $3,873 | $21,730 | $9,751 | $11,979 |
| 2015 | $2,253 | $19,738 | $11,732 | $8,006 |
| 2014 | $2,253 | $19,738 | $11,526 | $8,212 |
Source: Public Records
Map
Nearby Homes
- 188-45 Quencer Rd
- 189-18 114th Dr
- 18918 Tioga Dr
- 187-15 Tioga Dr
- 115-72 Farmers Blvd
- 18908 114th Rd
- 116-39 Newburg St
- 191-16 114th Rd
- 115-11 180th St
- 191-34 114th Rd
- 191-47 114th Dr
- 191-68 115th Rd
- 18833 Keeseville Ave
- 116-39 192nd St
- 188-07 Mangin Ave
- 11620 194th St
- 194-19 115th Rd
- 189-21 117th Rd
- 18823 Mangin Ave
- 188-25 Mangin Ave
- 11539 Newburgh St
- 188-11 Tioga Dr
- 188-11 Tioga Dr
- 188-11 Tioga Dr
- 18811 Tioga Dr
- 115-35 Newburg St
- 11535 Newburgh St
- 11553 Newburgh St
- 18815 Tioga Dr
- 188-15 Tioga Dr
- 115-57 Newburg St Unit ROOM
- 188-19 Tioga Dr
- 18819 Tioga Dr
- 11557 Newburgh St
- 115-29 Newburg St
- 18908 Quencer Rd
- 11542 Newburgh St
- 11529 Newburgh St
- 18814 Tioga Dr
- 18914 Quencer Rd