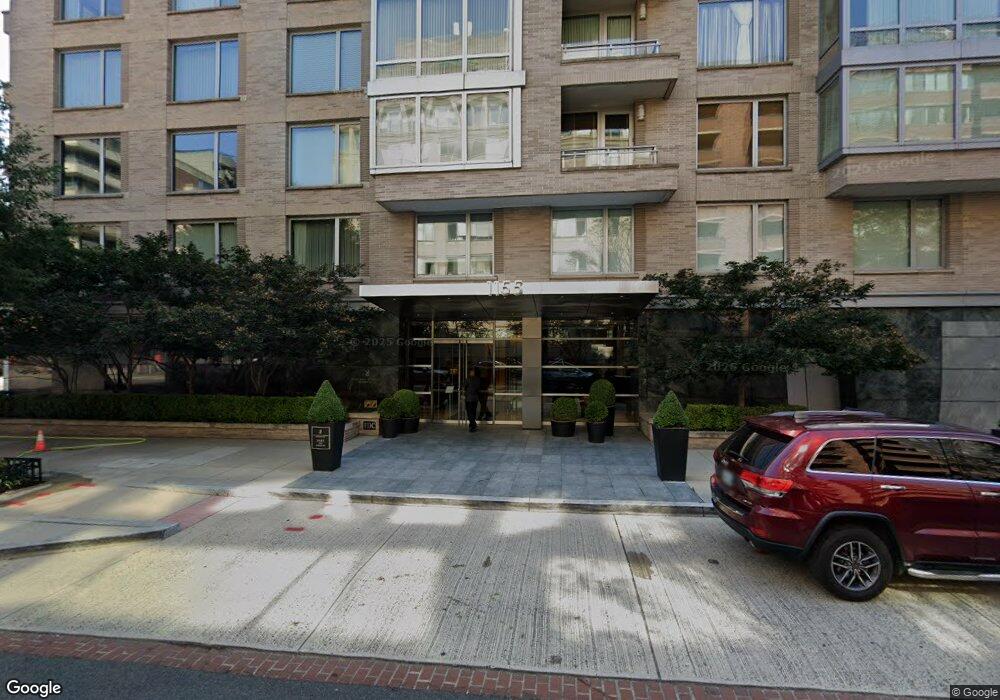
The Residences at The Ritz-Carlton 1155 23rd St NW Unit N8F Washington, DC 20037
West End NeighborhoodEstimated Value: $836,000 - $841,000
1
Bed
2
Baths
978
Sq Ft
$857/Sq Ft
Est. Value
About This Home
This home is located at 1155 23rd St NW Unit N8F, Washington, DC 20037 and is currently estimated at $838,291, approximately $857 per square foot. 1155 23rd St NW Unit N8F is a home located in District of Columbia with nearby schools including School Without Walls @ Francis-Stevens, Cardozo Education Campus, and Old Colony Montessori School.
Ownership History
Date
Name
Owned For
Owner Type
Purchase Details
Closed on
Sep 15, 2022
Sold by
Morris Jonathan H
Bought by
Kereiakes Nicholas D
Current Estimated Value
Home Financials for this Owner
Home Financials are based on the most recent Mortgage that was taken out on this home.
Original Mortgage
$665,500
Outstanding Balance
$628,600
Interest Rate
4.13%
Mortgage Type
New Conventional
Estimated Equity
$209,691
Purchase Details
Closed on
Apr 29, 2009
Sold by
Brown Lara
Bought by
Morris Jonathan
Home Financials for this Owner
Home Financials are based on the most recent Mortgage that was taken out on this home.
Original Mortgage
$701,057
Interest Rate
4.93%
Mortgage Type
FHA
Purchase Details
Closed on
Jan 3, 2001
Sold by
2200 M Street L L C
Bought by
Brown Lara M
Home Financials for this Owner
Home Financials are based on the most recent Mortgage that was taken out on this home.
Original Mortgage
$380,500
Interest Rate
7.69%
Create a Home Valuation Report for This Property
The Home Valuation Report is an in-depth analysis detailing your home's value as well as a comparison with similar homes in the area
Home Values in the Area
Average Home Value in this Area
Purchase History
| Date | Buyer | Sale Price | Title Company |
|---|---|---|---|
| Kereiakes Nicholas D | $845,500 | Paragon Title | |
| Morris Jonathan | $733,000 | -- | |
| Brown Lara M | $515,000 | -- |
Source: Public Records
Mortgage History
| Date | Status | Borrower | Loan Amount |
|---|---|---|---|
| Open | Kereiakes Nicholas D | $665,500 | |
| Previous Owner | Morris Jonathan | $701,057 | |
| Previous Owner | Brown Lara M | $380,500 |
Source: Public Records
Tax History Compared to Growth
Tax History
| Year | Tax Paid | Tax Assessment Tax Assessment Total Assessment is a certain percentage of the fair market value that is determined by local assessors to be the total taxable value of land and additions on the property. | Land | Improvement |
|---|---|---|---|---|
| 2025 | $5,973 | $859,180 | $257,750 | $601,430 |
| 2024 | $5,443 | $835,000 | $286,940 | $548,060 |
| 2023 | $4,967 | $683,010 | $329,370 | $353,640 |
| 2022 | $5,020 | $683,010 | $329,370 | $353,640 |
| 2021 | $5,044 | $683,010 | $204,900 | $478,110 |
| 2020 | $5,162 | $683,010 | $204,900 | $478,110 |
| 2019 | $5,169 | $683,010 | $204,900 | $478,110 |
| 2018 | $5,182 | $683,010 | $0 | $0 |
| 2017 | $5,021 | $663,120 | $0 | $0 |
| 2016 | $4,759 | $631,540 | $0 | $0 |
| 2015 | $4,506 | $601,470 | $0 | $0 |
| 2014 | $4,391 | $586,800 | $0 | $0 |
Source: Public Records
About The Residences at The Ritz-Carlton
Map
Nearby Homes
- 1177 22nd St NW Unit 4F
- 1177 22nd St NW Unit 2K
- 1155 23rd St NW Unit 7G
- 1155 23rd St NW Unit PH1G
- 1155 23rd St NW Unit 6G
- 1155 23rd St NW Unit 6C
- 1155 23rd St NW Unit 3D
- 1111 23rd St NW Unit 4G
- 1111 23rd St NW Unit 4F
- 1111 23rd St NW Unit 4C
- 1099 22nd St NW Unit 206
- 1099 22nd St NW Unit 304
- 3 Washington Cir NW Unit 905
- 1111 24th St NW Unit 81
- 1111 24th St NW Unit 53
- 2114 N St NW Unit 32
- 2130 N St NW Unit 509
- 2130 N St NW Unit 407
- 1260 21st St NW Unit 107
- 1260 21st St NW Unit 1004
- 1155 23rd St NW Unit NP-2C
- 1155 23rd St NW Unit PRES PH2
- 1155 23rd St NW Unit 5C
- 1155 23rd St NW Unit 2E
- 1155 23rd St NW Unit 2L
- 1155 23rd St NW Unit PH1M
- 1155 23rd St NW Unit PH3P
- 1155 23rd St NW Unit PH2G
- 1155 23rd St NW Unit 5A
- 1155 23rd St NW Unit 4B
- 1155 23rd St NW Unit N6D
- 1155 23rd St NW Unit N5E
- 1155 23rd St NW Unit NPH1D
- 1155 23rd St NW Unit N5M
- 1155 23rd St NW Unit N5J
- 1155 23rd St NW Unit N8K
- 1155 23rd St NW Unit NPH1E
- 1155 23rd St NW Unit N3B
- 1155 23rd St NW Unit N3C
- 1155 23rd St NW Unit N7C