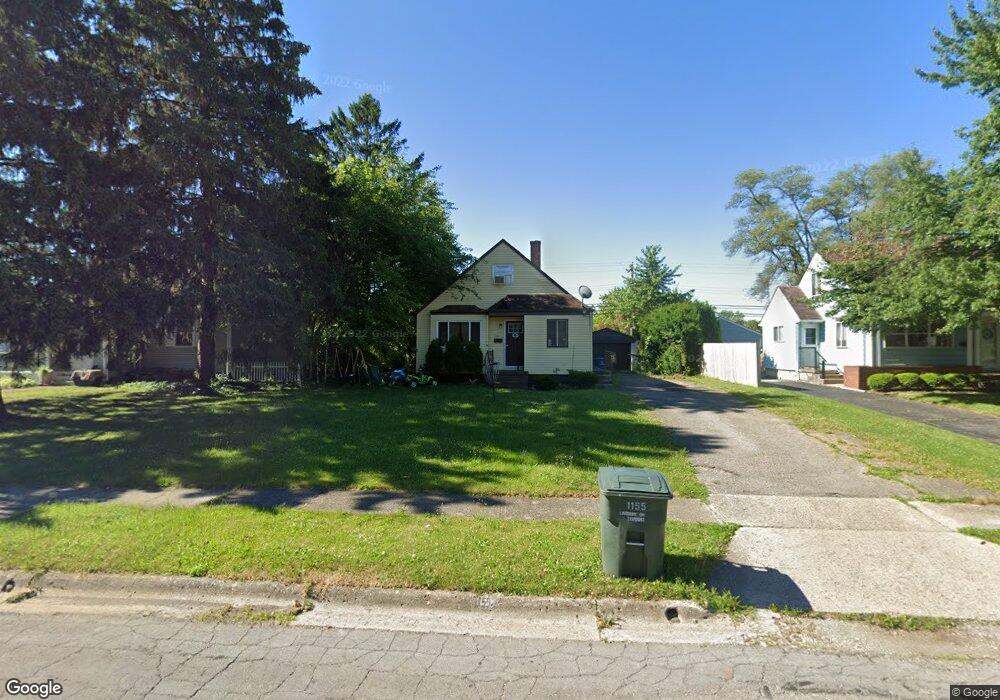
1155 Carbone Dr Columbus, OH 43224
Clinton Estates NeighborhoodEstimated Value: $197,000 - $277,000
3
Beds
1
Bath
1,135
Sq Ft
$208/Sq Ft
Est. Value
About This Home
This home is located at 1155 Carbone Dr, Columbus, OH 43224 and is currently estimated at $236,028, approximately $207 per square foot. 1155 Carbone Dr is a home located in Franklin County with nearby schools including Maize Road Elementary School, Medina Middle School, and Mifflin High School.
Ownership History
Date
Name
Owned For
Owner Type
Purchase Details
Closed on
Jan 29, 2013
Sold by
Red Zone Properties 1 Llc
Bought by
Red Zone Properties Llc
Current Estimated Value
Purchase Details
Closed on
Dec 23, 2009
Sold by
Sage Realty Partners Ltd
Bought by
Red Zone Properties I Llc
Purchase Details
Closed on
Sep 1, 2004
Sold by
Agresti Samuel J and Agresti Ruta E
Bought by
Sage Realty Partners Ltd
Purchase Details
Closed on
Mar 23, 2004
Sold by
Behling Esther Brooks
Bought by
Agresti Samuel J and Mudrey Kevin L
Home Financials for this Owner
Home Financials are based on the most recent Mortgage that was taken out on this home.
Original Mortgage
$75,650
Interest Rate
4.62%
Mortgage Type
Purchase Money Mortgage
Purchase Details
Closed on
Nov 21, 2001
Sold by
Behling Joseph W
Bought by
Behling Esther Brooks
Create a Home Valuation Report for This Property
The Home Valuation Report is an in-depth analysis detailing your home's value as well as a comparison with similar homes in the area
Home Values in the Area
Average Home Value in this Area
Purchase History
| Date | Buyer | Sale Price | Title Company |
|---|---|---|---|
| Red Zone Properties Llc | $92,500 | None Available | |
| Red Zone Properties I Llc | -- | Title Co Lt | |
| Sage Realty Partners Ltd | -- | -- | |
| Agresti Samuel J | $89,000 | Title First Agency Inc | |
| Behling Esther Brooks | -- | -- |
Source: Public Records
Mortgage History
| Date | Status | Borrower | Loan Amount |
|---|---|---|---|
| Previous Owner | Agresti Samuel J | $75,650 |
Source: Public Records
Tax History
| Year | Tax Paid | Tax Assessment Tax Assessment Total Assessment is a certain percentage of the fair market value that is determined by local assessors to be the total taxable value of land and additions on the property. | Land | Improvement |
|---|---|---|---|---|
| 2025 | $2,969 | $64,790 | $19,250 | $45,540 |
| 2024 | $2,969 | $64,790 | $19,250 | $45,540 |
| 2023 | $2,932 | $64,785 | $19,250 | $45,535 |
| 2022 | $2,203 | $41,450 | $7,880 | $33,570 |
| 2021 | $2,553 | $41,450 | $7,880 | $33,570 |
| 2020 | $2,339 | $41,450 | $7,880 | $33,570 |
| 2019 | $2,063 | $33,180 | $6,300 | $26,880 |
| 2018 | $1,788 | $33,180 | $6,300 | $26,880 |
| 2017 | $1,883 | $33,180 | $6,300 | $26,880 |
| 2016 | $1,703 | $24,510 | $6,480 | $18,030 |
| 2015 | $1,516 | $24,510 | $6,480 | $18,030 |
| 2014 | $1,520 | $24,510 | $6,480 | $18,030 |
| 2013 | $1,042 | $32,375 | $6,475 | $25,900 |
Source: Public Records
Map
Nearby Homes
- 1130 Carbone Dr
- 899 Meadowview Dr
- 4143 Karl Rd Unit 215
- 4143 Karl Rd Unit 314
- 4145 Karl Rd Unit 223
- 1144 Reed Circle Dr
- 3941 Karl Rd Unit 326
- 3967 Karl Rd Unit 224
- 3939 Karl Rd Unit 311
- 827 Inwood Place
- 991 Hidden Acres Ct Unit 991
- 4605 Glenmawr Ave
- 1242 Acton Rd
- 1116 Tulsa Dr
- 3620 Walmar Dr
- 4800 Bourke Rd
- 4795 Colonel Perry Dr
- 4299 Colerain Ave
- 3585 Gerbert Rd
- 1863 Ward Rd
Your Personal Tour Guide
Ask me questions while you tour the home.