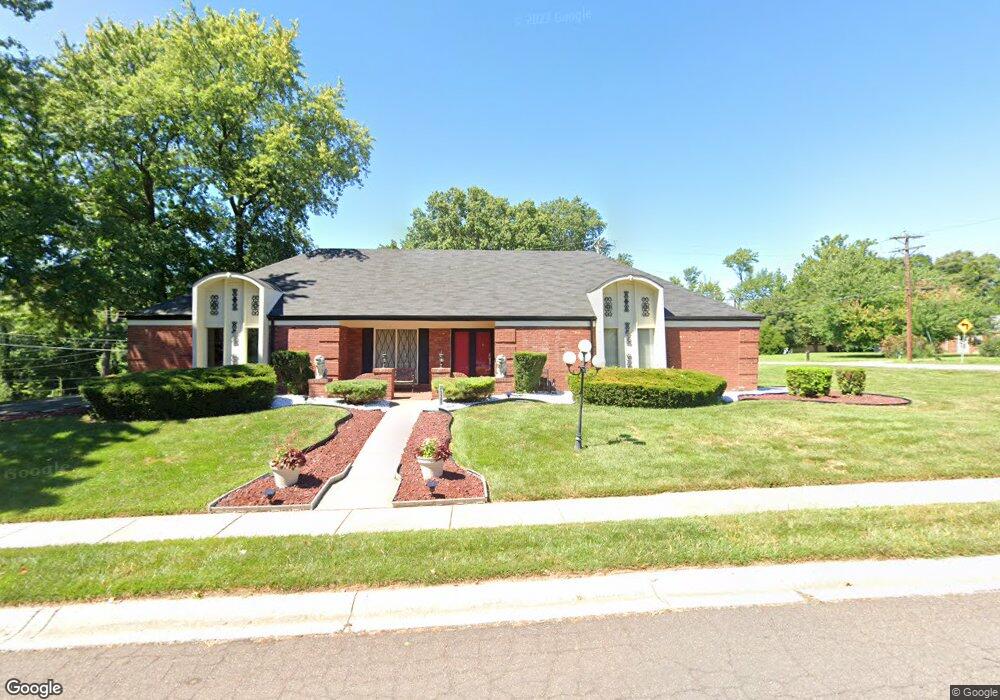
1155 Chatelet Dr Saint Louis, MO 63135
Estimated Value: $232,241 - $287,000
3
Beds
2
Baths
2,112
Sq Ft
$121/Sq Ft
Est. Value
About This Home
This home is located at 1155 Chatelet Dr, Saint Louis, MO 63135 and is currently estimated at $254,560, approximately $120 per square foot. 1155 Chatelet Dr is a home located in St. Louis County with nearby schools including Lee Hamilton Elementary School, Ferguson Middle School, and McCluer High School.
Ownership History
Date
Name
Owned For
Owner Type
Purchase Details
Closed on
Jul 10, 2002
Sold by
Clark Freddy J and Clark Cheryl L
Bought by
Hankins Lee L and Hankins Mary R
Current Estimated Value
Home Financials for this Owner
Home Financials are based on the most recent Mortgage that was taken out on this home.
Original Mortgage
$114,000
Outstanding Balance
$48,498
Interest Rate
6.76%
Estimated Equity
$206,062
Purchase Details
Closed on
May 13, 2002
Sold by
Murphy Christopher C and Murphy Patricia M
Bought by
Cendant Mobility Financial Corp
Home Financials for this Owner
Home Financials are based on the most recent Mortgage that was taken out on this home.
Original Mortgage
$114,000
Outstanding Balance
$48,498
Interest Rate
6.76%
Estimated Equity
$206,062
Purchase Details
Closed on
Dec 3, 1998
Sold by
Jones China M
Bought by
Clark Freddy J and Clark Cheryl L
Home Financials for this Owner
Home Financials are based on the most recent Mortgage that was taken out on this home.
Original Mortgage
$138,700
Interest Rate
6.81%
Mortgage Type
FHA
Purchase Details
Closed on
May 22, 1998
Sold by
Frederick Jones
Bought by
Jones China M
Create a Home Valuation Report for This Property
The Home Valuation Report is an in-depth analysis detailing your home's value as well as a comparison with similar homes in the area
Home Values in the Area
Average Home Value in this Area
Purchase History
| Date | Buyer | Sale Price | Title Company |
|---|---|---|---|
| Hankins Lee L | $187,500 | -- | |
| Cendant Mobility Financial Corp | -- | -- | |
| Clark Freddy J | $141,000 | -- | |
| Jones China M | -- | -- |
Source: Public Records
Mortgage History
| Date | Status | Borrower | Loan Amount |
|---|---|---|---|
| Open | Hankins Lee L | $114,000 | |
| Previous Owner | Clark Freddy J | $138,700 |
Source: Public Records
Tax History Compared to Growth
Tax History
| Year | Tax Paid | Tax Assessment Tax Assessment Total Assessment is a certain percentage of the fair market value that is determined by local assessors to be the total taxable value of land and additions on the property. | Land | Improvement |
|---|---|---|---|---|
| 2025 | $3,087 | $48,380 | $6,900 | $41,480 |
| 2024 | $3,087 | $42,920 | $3,950 | $38,970 |
| 2023 | $3,069 | $42,920 | $3,950 | $38,970 |
| 2022 | $2,890 | $35,210 | $5,130 | $30,080 |
| 2021 | $2,797 | $35,210 | $5,130 | $30,080 |
| 2020 | $2,768 | $31,330 | $5,910 | $25,420 |
| 2019 | $2,715 | $31,330 | $5,910 | $25,420 |
| 2018 | $2,608 | $26,830 | $3,630 | $23,200 |
| 2017 | $2,556 | $26,830 | $3,630 | $23,200 |
| 2016 | $2,361 | $24,360 | $3,230 | $21,130 |
| 2015 | $2,376 | $24,360 | $3,230 | $21,130 |
| 2014 | $2,355 | $23,870 | $4,470 | $19,400 |
Source: Public Records
Map
Nearby Homes
- 823 Le Maisson Dr
- 810 Chateau Valley Ct
- 655 Hunters Ridge Dr
- 643 Hunters Ridge Dr
- 925 Dyerdown Ave
- 941 N Elizabeth Ave
- 1226 Beaver Trail Dr
- 6 Sandringham Ln
- 931 Thatcher Ave
- 1315 Hendrick Dr
- 818 Robert Ave
- 539 Coppinger Dr
- 610 Superior Dr
- 401 Calverton Rd
- 1562 Starlight Dr
- 1400 Hudson Rd
- 514 La Motte Ln
- 15 Lake Pembroke Dr
- 506 Averill Ave
- 1355 Stein Rd
- 816 Hudson Rd
- 836 Hudson Rd
- 1147 Chatelet Dr
- 827 Hudson Rd
- 835 Hudson Rd
- 806 Hudson Rd
- 842 Hudson Rd
- 1140 Chatelet Dr
- 815 Hudson Rd
- 1139 Chatelet Dr
- 843 Hudson Rd
- 813 Chatelet Ct
- 1131 Chatelet Dr
- 801 Hudson Rd
- 742 Hudson Rd
- 855 Hudson Rd
- 806 Chatelet Ct
- 1208 Chateau Woods Dr
- 738 Hudson Rd
- 814 Chatelet Ct