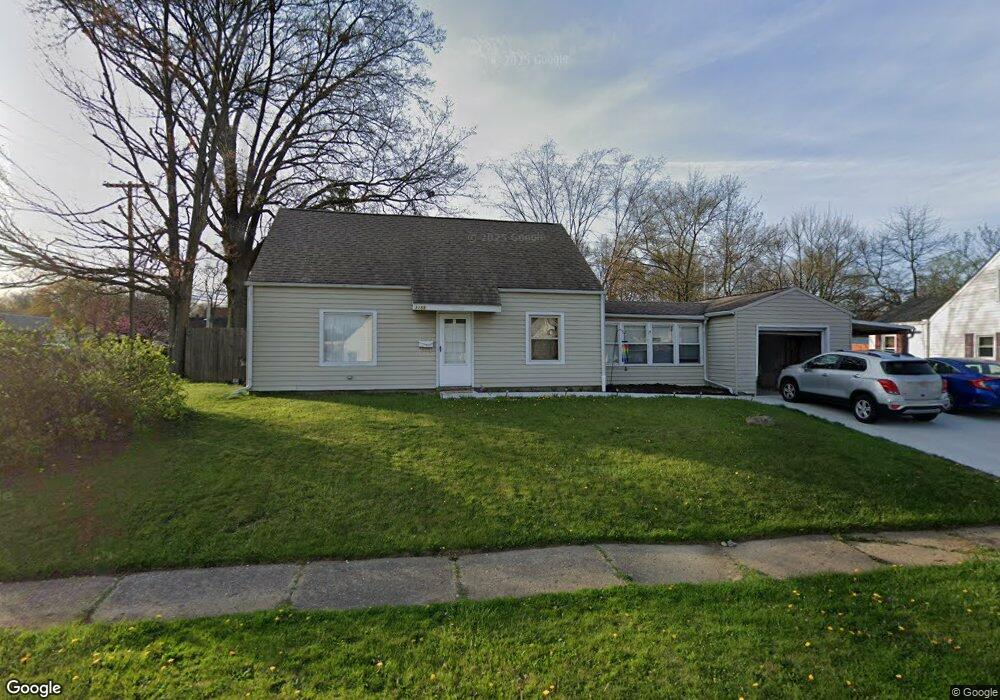
1155 Curtis Ave Cuyahoga Falls, OH 44221
Heslop Morningview NeighborhoodEstimated Value: $129,000 - $183,664
3
Beds
1
Bath
1,200
Sq Ft
$137/Sq Ft
Est. Value
About This Home
This home is located at 1155 Curtis Ave, Cuyahoga Falls, OH 44221 and is currently estimated at $164,416, approximately $137 per square foot. 1155 Curtis Ave is a home located in Summit County with nearby schools including Elizabeth Price Elementary School, Bolich Middle School, and Cuyahoga Falls High School.
Ownership History
Date
Name
Owned For
Owner Type
Purchase Details
Closed on
Jan 25, 2016
Sold by
Casto James L
Bought by
1155 Curtis Ltd
Current Estimated Value
Purchase Details
Closed on
Jul 1, 2010
Sold by
The Huntington National Bank
Bought by
Casto James L
Purchase Details
Closed on
Apr 21, 2010
Sold by
Knoles James W and Knoles James
Bought by
The Huntington National Bank
Purchase Details
Closed on
Feb 27, 2004
Sold by
Tabak Perry A
Bought by
Knoles James
Home Financials for this Owner
Home Financials are based on the most recent Mortgage that was taken out on this home.
Original Mortgage
$101,800
Interest Rate
6.5%
Mortgage Type
Purchase Money Mortgage
Purchase Details
Closed on
Jul 31, 1995
Sold by
Glover James A
Bought by
Tabak Perry A
Home Financials for this Owner
Home Financials are based on the most recent Mortgage that was taken out on this home.
Original Mortgage
$72,648
Interest Rate
7.59%
Mortgage Type
FHA
Create a Home Valuation Report for This Property
The Home Valuation Report is an in-depth analysis detailing your home's value as well as a comparison with similar homes in the area
Home Values in the Area
Average Home Value in this Area
Purchase History
| Date | Buyer | Sale Price | Title Company |
|---|---|---|---|
| 1155 Curtis Ltd | -- | None Available | |
| Casto James L | $58,500 | Landamerica | |
| The Huntington National Bank | $56,000 | Attorney | |
| Knoles James | $101,800 | Americas Choice Title Agency | |
| Tabak Perry A | $72,700 | -- |
Source: Public Records
Mortgage History
| Date | Status | Borrower | Loan Amount |
|---|---|---|---|
| Previous Owner | Knoles James | $101,800 | |
| Previous Owner | Tabak Perry A | $72,648 |
Source: Public Records
Tax History Compared to Growth
Tax History
| Year | Tax Paid | Tax Assessment Tax Assessment Total Assessment is a certain percentage of the fair market value that is determined by local assessors to be the total taxable value of land and additions on the property. | Land | Improvement |
|---|---|---|---|---|
| 2025 | $2,645 | $47,905 | $9,482 | $38,423 |
| 2024 | $2,645 | $47,905 | $9,482 | $38,423 |
| 2023 | $2,645 | $47,905 | $9,482 | $38,423 |
| 2022 | $2,472 | $36,393 | $7,182 | $29,211 |
| 2021 | $2,472 | $36,393 | $7,182 | $29,211 |
| 2020 | $2,433 | $36,390 | $7,180 | $29,210 |
| 2019 | $1,881 | $25,640 | $7,180 | $18,460 |
| 2018 | $1,651 | $25,640 | $7,180 | $18,460 |
| 2017 | $1,500 | $25,640 | $7,180 | $18,460 |
| 2016 | $1,551 | $24,250 | $7,180 | $17,070 |
| 2015 | $1,500 | $24,250 | $7,180 | $17,070 |
| 2014 | $1,501 | $24,250 | $7,180 | $17,070 |
| 2013 | $1,492 | $24,320 | $7,180 | $17,140 |
Source: Public Records
Map
Nearby Homes
- 1219 Curtis Ave
- 1921 Dwight St
- 2289 Bailey Rd
- 806 Curtis Ave
- 1521 Anderson Rd
- 1120 Saxe Ave
- 721 Myrtle Ave
- 2300 Larchdale Dr
- 2365 Schubert Ave
- 1473 Munroe Falls Ave Unit 5
- 2183 Plymouth Ln
- 1944 High St
- 1512 Treasch Dr
- 1916 Victoria St
- 2375 Plymouth Ln
- 955 Davis Ave
- 562 Tallmadge Rd
- 116 Munroe Falls Ave
- 616 Tallmadge Rd
- 2604 Hawthorne Rd
- 2045 Bailey Rd
- 1165 Curtis Ave
- 2049 Bailey Rd
- 2029 Bailey Rd
- 1175 Curtis Ave
- 1176 Curtis Ave
- 2042 Bailey Rd
- 1126 Myrtle Ave
- 2046 Bailey Rd
- 1106 Myrtle Ave
- 1185 Curtis Ave
- 1136 Myrtle Ave
- 1196 Curtis Ave
- 2025 Bailey Rd
- 1146 Myrtle Ave
- 1195 Curtis Ave
- 1156 Myrtle Ave
- 1214 Anderson Rd
- 2021 Bailey Rd
- 1166 Myrtle Ave