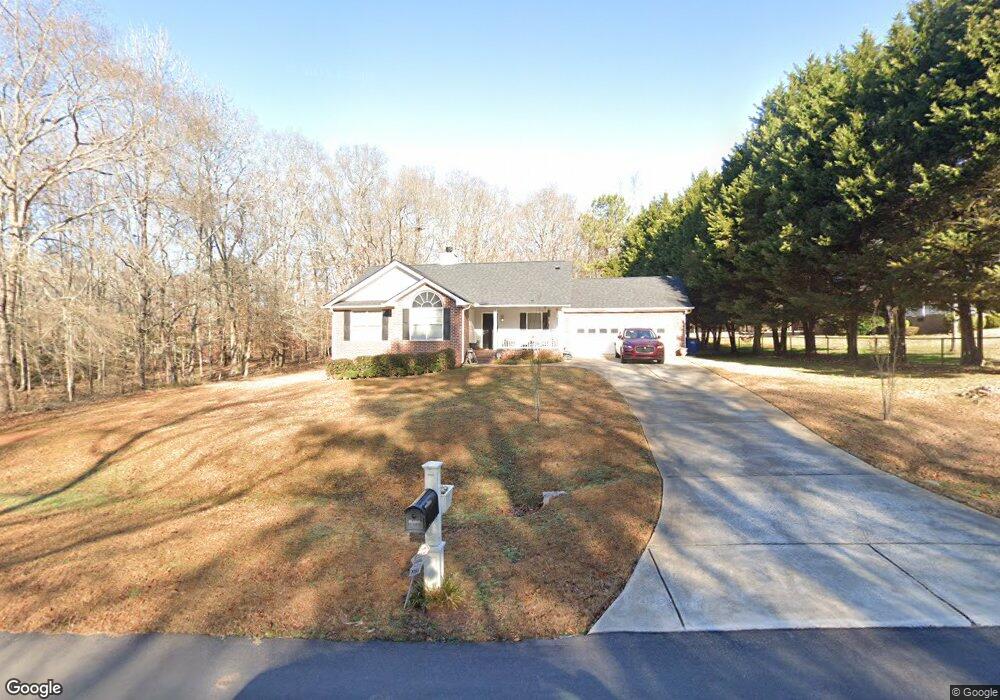
1155 Darlington Station Rd Bogart, GA 30622
Estimated Value: $311,813 - $386,000
3
Beds
2
Baths
1,384
Sq Ft
$245/Sq Ft
Est. Value
About This Home
This home is located at 1155 Darlington Station Rd, Bogart, GA 30622 and is currently estimated at $338,453, approximately $244 per square foot. 1155 Darlington Station Rd is a home located in Clarke County with nearby schools including Cleveland Road Elementary School, Burney-Harris-Lyons Middle School, and Clarke Central High School.
Ownership History
Date
Name
Owned For
Owner Type
Purchase Details
Closed on
Apr 20, 2018
Sold by
Khan Muhammad A
Bought by
Howard Sandy
Current Estimated Value
Home Financials for this Owner
Home Financials are based on the most recent Mortgage that was taken out on this home.
Original Mortgage
$164,900
Outstanding Balance
$141,844
Interest Rate
4.45%
Mortgage Type
New Conventional
Estimated Equity
$196,609
Purchase Details
Closed on
Sep 1, 2006
Sold by
Not Provided
Bought by
Khan Muhmmad A
Purchase Details
Closed on
Mar 29, 2002
Sold by
Khan Muhammad A
Bought by
Sabeen Rizwana
Purchase Details
Closed on
Oct 24, 2001
Sold by
Orr D Lanier Dba Lanier Builde
Bought by
James R Hunter Construction Inc
Purchase Details
Closed on
Jul 1, 1999
Sold by
Sosbee Roy Lee John D Sosbee and Sosbee Stanley
Bought by
Orr D Lanier Dba Lanier Builders
Create a Home Valuation Report for This Property
The Home Valuation Report is an in-depth analysis detailing your home's value as well as a comparison with similar homes in the area
Home Values in the Area
Average Home Value in this Area
Purchase History
| Date | Buyer | Sale Price | Title Company |
|---|---|---|---|
| Howard Sandy | $170,000 | -- | |
| Khan Muhmmad A | -- | -- | |
| Sabeen Rizwana | -- | -- | |
| Khan Muhammad A | $130,500 | -- | |
| James R Hunter Construction Inc | $23,300 | -- | |
| Orr D Lanier Dba Lanier Builders | $45,000 | -- |
Source: Public Records
Mortgage History
| Date | Status | Borrower | Loan Amount |
|---|---|---|---|
| Open | Howard Sandy | $164,900 |
Source: Public Records
Tax History Compared to Growth
Tax History
| Year | Tax Paid | Tax Assessment Tax Assessment Total Assessment is a certain percentage of the fair market value that is determined by local assessors to be the total taxable value of land and additions on the property. | Land | Improvement |
|---|---|---|---|---|
| 2024 | $3,086 | $110,764 | $12,000 | $98,764 |
| 2023 | $2,083 | $101,640 | $12,000 | $89,640 |
| 2022 | $2,391 | $84,956 | $11,200 | $73,756 |
| 2021 | $2,046 | $70,701 | $11,200 | $59,501 |
| 2020 | $1,864 | $65,316 | $11,200 | $54,116 |
| 2019 | $1,772 | $62,202 | $11,200 | $51,002 |
| 2018 | $1,517 | $54,686 | $11,200 | $43,486 |
| 2017 | $1,496 | $54,061 | $11,200 | $42,861 |
| 2016 | $1,333 | $49,273 | $11,200 | $38,073 |
| 2015 | $1,331 | $49,144 | $11,200 | $37,944 |
| 2014 | $1,309 | $48,433 | $11,200 | $37,233 |
Source: Public Records
Map
Nearby Homes
- 1165 Darlington Station Rd
- 1170 Darlington Station Rd
- 1180 Darlington Station Rd
- 1145 Darlington Station Rd
- 1175 Darlington Station Rd
- 1160 Darlington Station Rd
- 1190 Darlington Station Rd
- 1180 Darlington Rd
- 1150 Darlington Station Rd
- 195 Woodglen Rd
- 1135 Darlington Station Rd
- 1140 Darlington Station Rd
- 1125 Darlington Station Rd
- 175 Woodglen Rd
- 1130 Darlington Station Rd
- 220 Bambi Trace
- 0 Wade Dr Unit 7534825
- 0 Wade Dr Unit 8629722
- 0 Wade Dr Unit 8340969