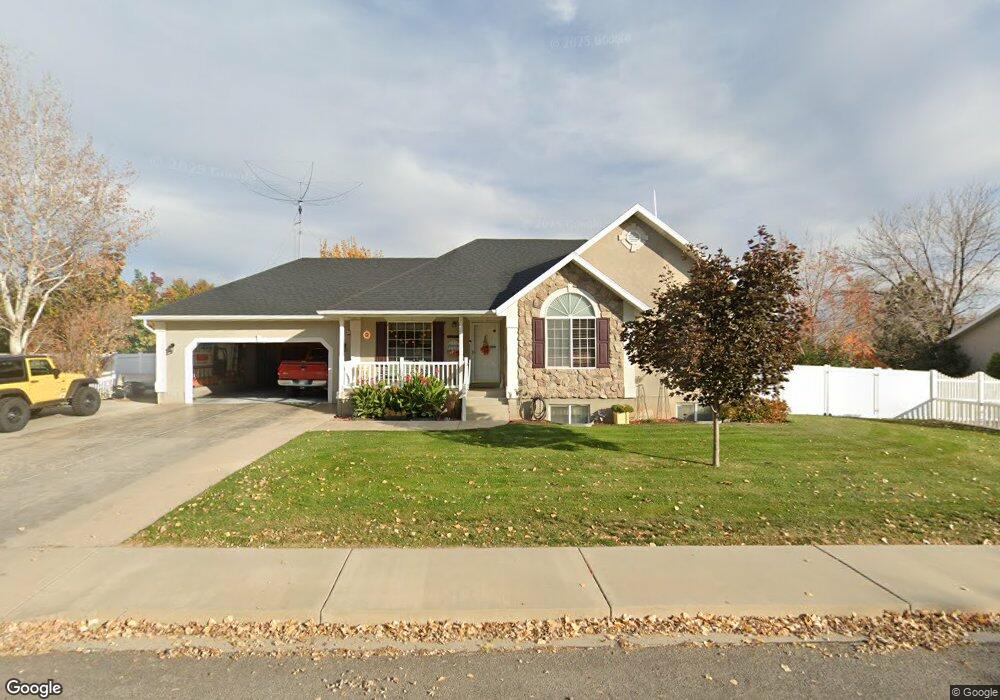
1155 E 420 S Payson, UT 84651
Estimated Value: $507,000 - $546,000
3
Beds
2
Baths
1,485
Sq Ft
$352/Sq Ft
Est. Value
About This Home
This home is located at 1155 E 420 S, Payson, UT 84651 and is currently estimated at $523,262, approximately $352 per square foot. 1155 E 420 S is a home located in Utah County with nearby schools including Barnett Elementary School, Salem Junior High School, and Valley View Middle School.
Ownership History
Date
Name
Owned For
Owner Type
Purchase Details
Closed on
Aug 17, 2018
Sold by
Bushinell Cary Wardell and Bushinell Debra Elizabeth
Bought by
Bushinell Gary W and Bushinell Debra E
Current Estimated Value
Purchase Details
Closed on
Feb 8, 1999
Sold by
Taylor Homes Associates Inc
Bought by
Bushnell Gary Wardell and Bushnell Debra Elizabeth
Home Financials for this Owner
Home Financials are based on the most recent Mortgage that was taken out on this home.
Original Mortgage
$150,000
Outstanding Balance
$35,656
Interest Rate
6.79%
Estimated Equity
$487,606
Purchase Details
Closed on
Feb 5, 1999
Sold by
Taylor/Turner Properties Lc
Bought by
Taylor Homes Associates Inc
Home Financials for this Owner
Home Financials are based on the most recent Mortgage that was taken out on this home.
Original Mortgage
$150,000
Outstanding Balance
$35,656
Interest Rate
6.79%
Estimated Equity
$487,606
Create a Home Valuation Report for This Property
The Home Valuation Report is an in-depth analysis detailing your home's value as well as a comparison with similar homes in the area
Home Values in the Area
Average Home Value in this Area
Purchase History
| Date | Buyer | Sale Price | Title Company |
|---|---|---|---|
| Bushinell Gary W | -- | None Available | |
| Bushnell Gary Wardell | -- | First American Title Co | |
| Taylor Homes Associates Inc | -- | First American Title Co |
Source: Public Records
Mortgage History
| Date | Status | Borrower | Loan Amount |
|---|---|---|---|
| Open | Bushnell Gary Wardell | $150,000 |
Source: Public Records
Tax History
| Year | Tax Paid | Tax Assessment Tax Assessment Total Assessment is a certain percentage of the fair market value that is determined by local assessors to be the total taxable value of land and additions on the property. | Land | Improvement |
|---|---|---|---|---|
| 2025 | $2,550 | $270,655 | -- | -- |
| 2024 | $2,550 | $259,545 | $0 | $0 |
| 2023 | $2,600 | $265,320 | $0 | $0 |
| 2022 | $2,442 | $245,135 | $0 | $0 |
| 2021 | $2,052 | $330,400 | $120,600 | $209,800 |
| 2020 | $1,913 | $301,300 | $104,900 | $196,400 |
| 2019 | $1,714 | $276,700 | $86,800 | $189,900 |
| 2018 | $1,703 | $265,000 | $79,600 | $185,400 |
| 2017 | $1,582 | $132,440 | $0 | $0 |
| 2016 | $1,511 | $125,675 | $0 | $0 |
| 2015 | $1,368 | $112,970 | $0 | $0 |
| 2014 | $1,252 | $104,115 | $0 | $0 |
Source: Public Records
Map
Nearby Homes
- 1327 E 320 S
- 412 S Goosenest Dr
- 426 S Goosenest Dr
- 753 N Emery Ln Unit 57
- 678 N Mountain View Dr
- 552 E Longview Dr Unit 29
- 348 E Dr E Unit 26
- 5620 W 8800 S Unit 2
- 643 E Longview Dr Unit 8
- 337 W 100 S
- 844 N Emery Ln Unit 59
- 942 W Wilcock Cove
- 4100 W 12400 S
- 523 1045 S 1700 S Unit 523
- 61 S Lighthouse Cir Unit 14
- 823 N Mountain Dr Unit 62
- 320 E East Ridgeview Dr Unit 27
- 627 E Birch N Unit 68
- 526 E Sophie Cir Unit 1
- 700 S Hillside Dr E
- 1152 E 370 S
- 1141 E 420 S
- 1177 E 420 S
- 1158 E 370 S
- 1154 E 420 S
- 1176 E 420 S
- 1142 E 420 S
- 1133 E 420 S
- 410 S 1200 E
- 2371 E 370 St N Unit 8
- 2363 E 370 St N Unit 7
- 2351 E 370 St N Unit 6
- 378 S 1200 E
- 1184 E 420 S
- 1153 E 470 S
- 1128 E 420 S
- 1157 E 370 S
- 1175 E 470 S
- 1149 E 370 S
- 255 S 1200 St E Unit 22
Your Personal Tour Guide
Ask me questions while you tour the home.