1155 McDonald Ct Corning, CA 96021
Estimated Value: $319,201 - $385,000
About This Home
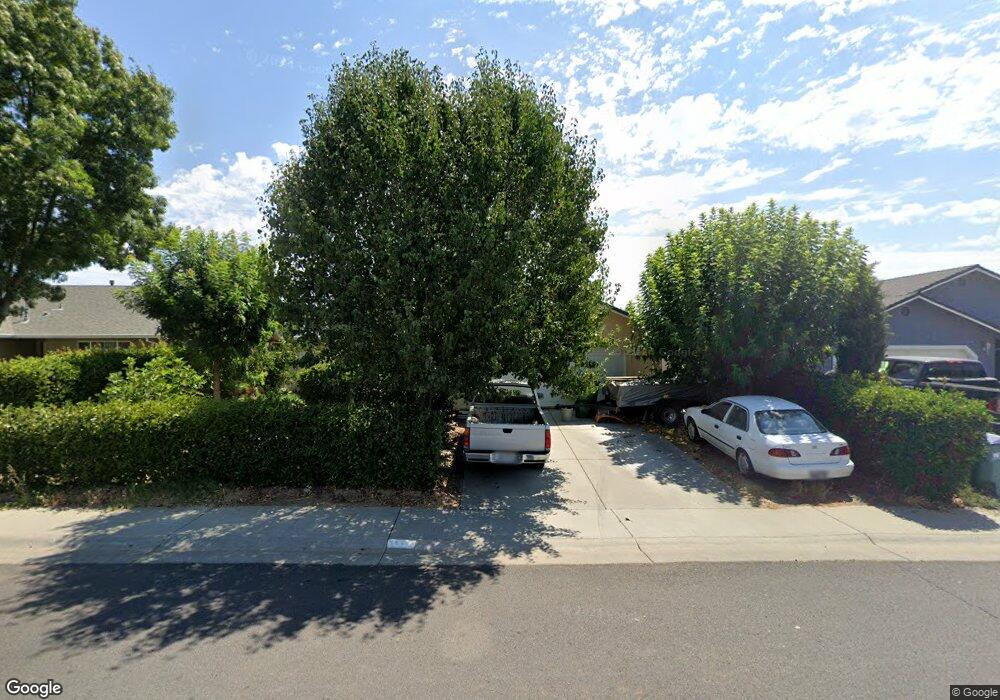
This home is located at 1155 McDonald Ct, Corning, CA 96021 and is currently estimated at $339,550, approximately $251 per square foot. 1155 McDonald Ct is a home located in Tehama County with nearby schools including Olive View Elementary School, Maywood Middle School, and Corning High School.
Ownership History
We collect this data history from publicly available records. To have your information removed, we recommend requesting removal directly through your county’s website.
Purchase Details
Home Financials for this Owner
Home Financials are based on the most recent Mortgage that was taken out on this home.Purchase Details
Purchase Details
Purchase Details
Purchase History
We collect this data history from publicly available records. To have your information removed, we recommend requesting removal directly through your county’s website.
| Date | Buyer | Sale Price | Title Company |
|---|---|---|---|
| $45,000 | Chicago Title Co | ||
| $84,000 | Chicago Title Co | ||
| $5,000 | Chicago Title Co | ||
| $5,000 | Chicago Title Co |
Mortgage History
We collect this data history from publicly available records. To have your information removed, we recommend requesting removal directly through your county’s website.
| Date | Status | Borrower | Loan Amount |
|---|---|---|---|
| Open | $12,000 | ||
| Open | $123,000 |
Tax History
We collect this data history from publicly available records. To have your information removed, we recommend requesting removal directly through your county’s website.
| Year | Tax Paid | Tax Assessment Tax Assessment Total Assessment is a certain percentage of the fair market value that is determined by local assessors to be the total taxable value of land and additions on the property. | Land | Improvement |
|---|---|---|---|---|
| 2025 | $2,348 | $223,181 | $64,951 | $158,230 |
| 2023 | $2,349 | $223,181 | $64,951 | $158,230 |
| 2022 | $2,363 | $223,181 | $64,951 | $158,230 |
| 2021 | $2,109 | $202,891 | $59,046 | $143,845 |
| 2020 | $1,873 | $176,427 | $51,344 | $125,083 |
| 2019 | $1,746 | $168,026 | $48,899 | $119,127 |
| 2018 | $1,622 | $152,751 | $44,454 | $108,297 |
| 2017 | $1,494 | $138,865 | $40,413 | $98,452 |
| 2016 | $1,354 | $132,253 | $38,489 | $93,764 |
| 2015 | -- | $132,253 | $38,489 | $93,764 |
| 2014 | $1,191 | $115,003 | $33,469 | $81,534 |
Map
- 1185 McDonald Ct
- 1111 McDonald Ct
- 1150 McDonald Ct
- 1180 McDonald Ct
- 1085 McDonald Ct
- 1102 McDonald Ct
- 1055 McDonald Ct
- 1150 E Cassandra Cir Unit 1
- 1150 E Cassandra Cir
- 1165 E Cassandra Cir
- 226 Carona Ave
- 1035 McDonald Ct
- 976 Snow Peak St
- 217 Carona Ave
- 220 Taylor Ct
- 1175 E Cassandra Cir
- 1180 E Cassandra Cir
- 1020 McDonald Ct
- 230 Taylor Ct
- 1031 McDonald Ct
Ask me questions while you tour the home.