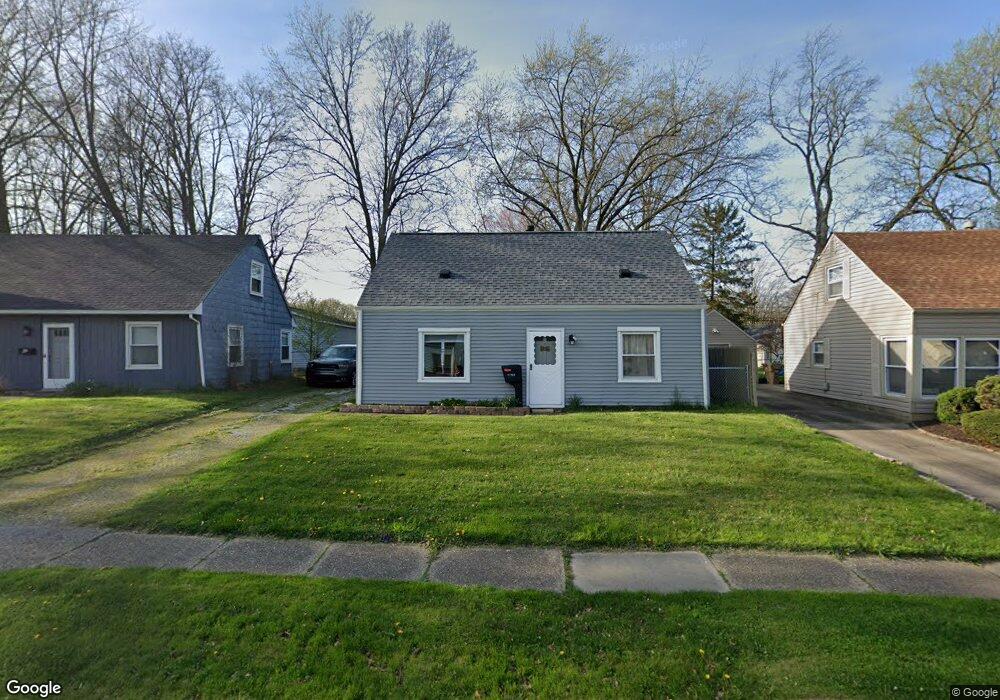
1155 Myrtle Ave Cuyahoga Falls, OH 44221
Heslop Morningview NeighborhoodEstimated Value: $129,000 - $180,579
4
Beds
1
Bath
1,120
Sq Ft
$141/Sq Ft
Est. Value
About This Home
This home is located at 1155 Myrtle Ave, Cuyahoga Falls, OH 44221 and is currently estimated at $157,895, approximately $140 per square foot. 1155 Myrtle Ave is a home located in Summit County with nearby schools including Elizabeth Price Elementary School, Roberts Middle School, and Cuyahoga Falls High School.
Ownership History
Date
Name
Owned For
Owner Type
Purchase Details
Closed on
Dec 18, 2009
Sold by
Secretary Of Housing & Urban Development
Bought by
Biggins Howard J
Current Estimated Value
Home Financials for this Owner
Home Financials are based on the most recent Mortgage that was taken out on this home.
Original Mortgage
$69,300
Outstanding Balance
$45,201
Interest Rate
4.9%
Mortgage Type
FHA
Estimated Equity
$112,694
Purchase Details
Closed on
Jul 27, 2009
Sold by
Petroski Matthew Stephan and Petroski Lori Denise
Bought by
Bac Home Loans Servicing Lp and Countrywide Home Loans Servicing Lp
Purchase Details
Closed on
Jul 23, 2009
Sold by
Bac Home Loans Servicing Lp
Bought by
The Secretary Of Housing & Urban Develop
Purchase Details
Closed on
Jan 10, 2006
Sold by
Chrzanowski Edward W
Bought by
Petroski Matthew Stephan and Petroski Lori Denise
Home Financials for this Owner
Home Financials are based on the most recent Mortgage that was taken out on this home.
Original Mortgage
$104,000
Interest Rate
8.9%
Mortgage Type
Purchase Money Mortgage
Create a Home Valuation Report for This Property
The Home Valuation Report is an in-depth analysis detailing your home's value as well as a comparison with similar homes in the area
Home Values in the Area
Average Home Value in this Area
Purchase History
| Date | Buyer | Sale Price | Title Company |
|---|---|---|---|
| Biggins Howard J | $64,854 | Attorney | |
| Bac Home Loans Servicing Lp | $62,000 | Attorney | |
| The Secretary Of Housing & Urban Develop | -- | Ohio Title | |
| Petroski Matthew Stephan | $104,000 | Real Living Title Agency Ltd |
Source: Public Records
Mortgage History
| Date | Status | Borrower | Loan Amount |
|---|---|---|---|
| Open | Biggins Howard J | $69,300 | |
| Previous Owner | Petroski Matthew Stephan | $104,000 |
Source: Public Records
Tax History Compared to Growth
Tax History
| Year | Tax Paid | Tax Assessment Tax Assessment Total Assessment is a certain percentage of the fair market value that is determined by local assessors to be the total taxable value of land and additions on the property. | Land | Improvement |
|---|---|---|---|---|
| 2025 | $2,643 | $46,050 | $10,616 | $35,434 |
| 2024 | $2,643 | $46,050 | $10,616 | $35,434 |
| 2023 | $2,643 | $46,050 | $10,616 | $35,434 |
| 2022 | $2,508 | $35,452 | $8,040 | $27,412 |
| 2021 | $2,408 | $35,452 | $8,040 | $27,412 |
| 2020 | $2,470 | $35,450 | $8,040 | $27,410 |
| 2019 | $2,434 | $31,800 | $8,040 | $23,760 |
| 2018 | $2,089 | $31,800 | $8,040 | $23,760 |
| 2017 | $1,863 | $31,800 | $8,040 | $23,760 |
| 2016 | $1,865 | $30,120 | $8,040 | $22,080 |
| 2015 | $1,863 | $30,120 | $8,040 | $22,080 |
| 2014 | $1,864 | $30,120 | $8,040 | $22,080 |
| 2013 | $1,861 | $30,320 | $8,040 | $22,280 |
Source: Public Records
Map
Nearby Homes
- 1219 Curtis Ave
- 2289 Bailey Rd
- 1921 Dwight St
- 806 Curtis Ave
- 721 Myrtle Ave
- 2300 Larchdale Dr
- 1521 Anderson Rd
- 1120 Saxe Ave
- 2365 Schubert Ave
- 1473 Munroe Falls Ave Unit 5
- 2183 Plymouth Ln
- 1944 High St
- 1512 Treasch Dr
- 1916 Victoria St
- 2375 Plymouth Ln
- 2604 Hawthorne Rd
- 116 Munroe Falls Ave
- 2610 Hawthorne Rd
- 955 Davis Ave
- 562 Tallmadge Rd
- 1145 Myrtle Ave
- 1165 Myrtle Ave
- 1175 Myrtle Ave
- 1135 Myrtle Ave
- 2131 Suncrest Cir
- 2127 Suncrest Dr
- 1125 Myrtle Ave
- 2125 Suncrest Dr
- 2135 Suncrest Cir
- 1156 Myrtle Ave
- 1146 Myrtle Ave
- 2129 Suncrest Dr
- 1166 Myrtle Ave
- 1203 Myrtle Ave
- 2119 Suncrest Dr
- 1115 Myrtle Ave
- 1136 Myrtle Ave
- 1186 Myrtle Ave
- 1126 Myrtle Ave
- 2139 Suncrest Cir