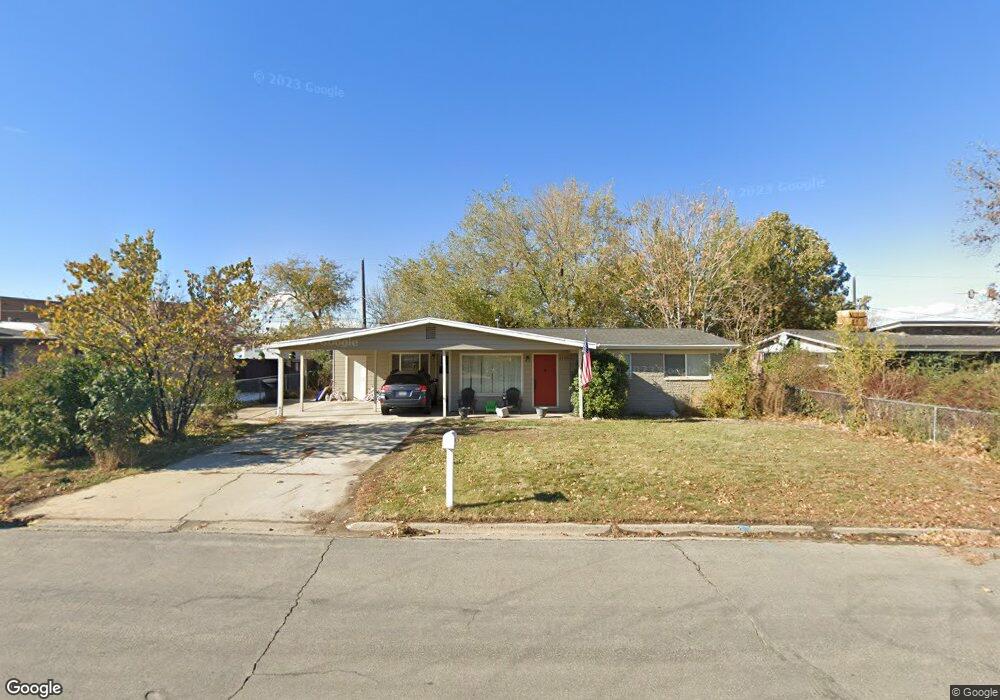
1155 N 400 W Bountiful, UT 84010
Estimated Value: $425,000 - $516,000
3
Beds
2
Baths
1,383
Sq Ft
$335/Sq Ft
Est. Value
About This Home
This home is located at 1155 N 400 W, Bountiful, UT 84010 and is currently estimated at $463,559, approximately $335 per square foot. 1155 N 400 W is a home located in Davis County with nearby schools including Meadowbrook Elementary School, Bountiful Junior High School, and Viewmont High School.
Ownership History
Date
Name
Owned For
Owner Type
Purchase Details
Closed on
Apr 8, 2020
Sold by
Pacheco Mindi and Winget Mindi
Bought by
Winget Brian and Winget Mindi
Current Estimated Value
Home Financials for this Owner
Home Financials are based on the most recent Mortgage that was taken out on this home.
Original Mortgage
$142,702
Outstanding Balance
$126,142
Interest Rate
3.4%
Mortgage Type
New Conventional
Estimated Equity
$337,417
Purchase Details
Closed on
Mar 25, 2020
Sold by
Pacheco Mindi
Bought by
Winget Brian and Pachcco Mindi
Home Financials for this Owner
Home Financials are based on the most recent Mortgage that was taken out on this home.
Original Mortgage
$142,702
Outstanding Balance
$126,142
Interest Rate
3.4%
Mortgage Type
New Conventional
Estimated Equity
$337,417
Purchase Details
Closed on
Jun 9, 2011
Sold by
Thompson Ronald Weir
Bought by
Oviatt Matt
Purchase Details
Closed on
May 19, 1997
Sold by
Thompson Robert T and Thompson Evelyn W
Bought by
Thompson Robert T and Thompson Evelyn W
Create a Home Valuation Report for This Property
The Home Valuation Report is an in-depth analysis detailing your home's value as well as a comparison with similar homes in the area
Purchase History
| Date | Buyer | Sale Price | Title Company |
|---|---|---|---|
| Winget Brian | -- | Backman Title Services | |
| Winget Brian | -- | Backman Title Services | |
| Oviatt Matt | -- | Richland Title Ins Ag | |
| Thompson Robert T | -- | -- |
Source: Public Records
Mortgage History
| Date | Status | Borrower | Loan Amount |
|---|---|---|---|
| Open | Winget Brian | $142,702 |
Source: Public Records
Tax History
| Year | Tax Paid | Tax Assessment Tax Assessment Total Assessment is a certain percentage of the fair market value that is determined by local assessors to be the total taxable value of land and additions on the property. | Land | Improvement |
|---|---|---|---|---|
| 2025 | $2,856 | $219,450 | $136,186 | $83,264 |
| 2024 | $2,571 | $211,200 | $122,861 | $88,339 |
| 2023 | $2,483 | $369,000 | $224,976 | $144,024 |
| 2022 | $2,635 | $210,100 | $122,564 | $87,536 |
| 2021 | $2,220 | $301,000 | $160,449 | $140,551 |
| 2020 | $2,012 | $246,000 | $136,556 | $109,444 |
| 2019 | $1,932 | $241,000 | $140,843 | $100,157 |
| 2018 | $1,737 | $218,000 | $137,984 | $80,016 |
| 2016 | $1,454 | $97,020 | $58,239 | $38,781 |
| 2015 | $1,410 | $88,330 | $58,239 | $30,091 |
| 2014 | $1,418 | $91,984 | $58,239 | $33,745 |
| 2013 | -- | $89,432 | $36,190 | $53,242 |
Source: Public Records
Map
Nearby Homes
- 366 W 1000 N
- 235 W 1400 N
- 1130 N 200 W
- 1260 N 200 W
- 1520 N 550 W
- 184 Park Shadows Cir
- 563 N 200 W
- 1625 Pages Place
- 328 W Pages Ln
- 106 W 700 N
- 499 N 200 W Unit 30
- 401 W 400 N Unit 49
- 399 W 400 N Unit 47
- 1767 N 600 W
- 290 N 500 W Unit 108
- 290 N 500 W Unit 305
- 332 N 300 W
- 204 Lyman Ln
- 320 N 200 W Unit 4
- 951 Centerville Commons Way
Your Personal Tour Guide
Ask me questions while you tour the home.