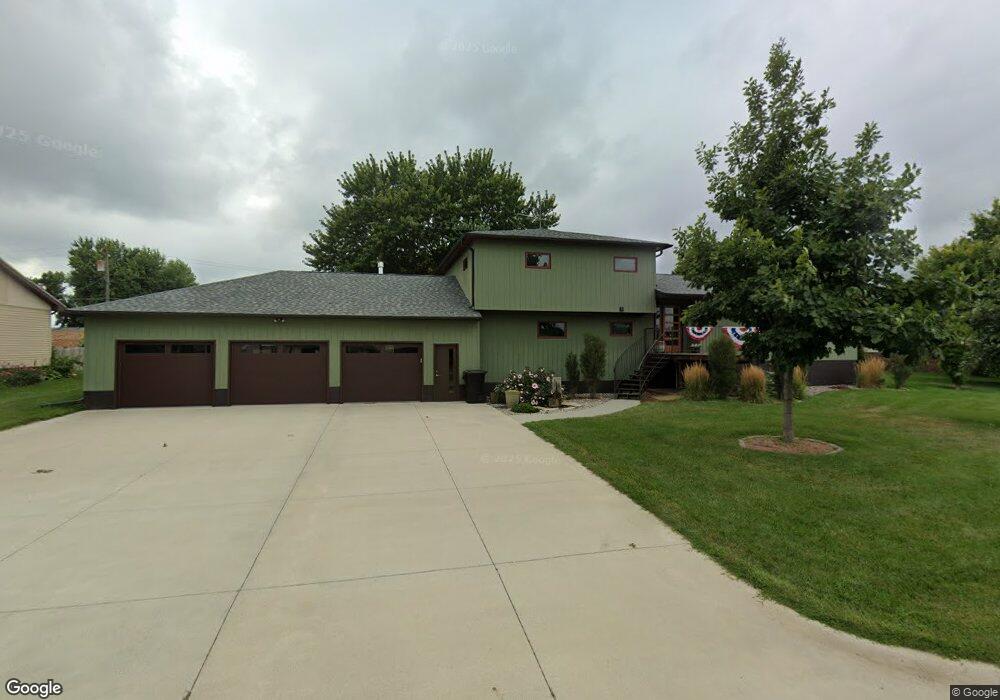
1155 Prinz St West Point, NE 68788
Estimated Value: $298,000 - $428,000
3
Beds
4
Baths
2,544
Sq Ft
$147/Sq Ft
Est. Value
About This Home
This home is located at 1155 Prinz St, West Point, NE 68788 and is currently estimated at $373,630, approximately $146 per square foot. 1155 Prinz St is a home located in Cuming County with nearby schools including West Point-Beemer Junior/Senior High School, Guardian Angels Elementary School, and St. Paul Lutheran School.
Ownership History
Date
Name
Owned For
Owner Type
Purchase Details
Closed on
May 4, 2010
Sold by
Feller Douglas J and Feller Carolyn A
Bought by
James Scott J and Babl Mary L
Current Estimated Value
Home Financials for this Owner
Home Financials are based on the most recent Mortgage that was taken out on this home.
Original Mortgage
$132,554
Outstanding Balance
$87,023
Interest Rate
4.87%
Mortgage Type
FHA
Estimated Equity
$286,607
Purchase Details
Closed on
Nov 3, 2009
Sold by
Hass Arvid F and Hass Karen A
Bought by
Feller Douglas J and Feller Carolyn A
Purchase Details
Closed on
Dec 13, 2007
Sold by
Mundorf Eldon G and Mundorf Willis
Bought by
Hass Arvid and Hass Karen
Home Financials for this Owner
Home Financials are based on the most recent Mortgage that was taken out on this home.
Original Mortgage
$125,000
Interest Rate
6.23%
Mortgage Type
Seller Take Back
Create a Home Valuation Report for This Property
The Home Valuation Report is an in-depth analysis detailing your home's value as well as a comparison with similar homes in the area
Home Values in the Area
Average Home Value in this Area
Purchase History
| Date | Buyer | Sale Price | Title Company |
|---|---|---|---|
| James Scott J | $135,000 | -- | |
| Feller Douglas J | $120,000 | -- | |
| Hass Arvid | $1,500,000 | -- |
Source: Public Records
Mortgage History
| Date | Status | Borrower | Loan Amount |
|---|---|---|---|
| Open | James Scott J | $132,554 | |
| Previous Owner | Hass Arvid | $125,000 |
Source: Public Records
Tax History Compared to Growth
Tax History
| Year | Tax Paid | Tax Assessment Tax Assessment Total Assessment is a certain percentage of the fair market value that is determined by local assessors to be the total taxable value of land and additions on the property. | Land | Improvement |
|---|---|---|---|---|
| 2025 | $3,317 | $426,865 | $38,225 | $388,640 |
| 2024 | $3,317 | $391,495 | $38,225 | $353,270 |
| 2023 | $4,335 | $375,635 | $33,780 | $341,855 |
| 2022 | $4,313 | $340,950 | $33,780 | $307,170 |
| 2021 | $4,059 | $304,670 | $31,115 | $273,555 |
| 2020 | $3,854 | $288,580 | $31,115 | $257,465 |
| 2019 | $3,763 | $275,385 | $31,115 | $244,270 |
| 2018 | $3,312 | $241,330 | $31,115 | $210,215 |
| 2017 | $2,992 | $213,320 | $31,115 | $182,205 |
| 2016 | $2,930 | $202,825 | $27,560 | $175,265 |
| 2015 | $3,117 | $202,825 | $27,560 | $175,265 |
| 2014 | $2,384 | $170,845 | $27,560 | $143,285 |
| 2013 | $2,384 | $148,350 | $27,560 | $120,790 |
Source: Public Records
Map
Nearby Homes
- 1207 N Main St
- 1402 E Bridge St
- 208 N Lincoln St
- 749 E Grove St
- 126 E Grove St
- 101 S Main St
- 1045 E Grove St
- 420 S Farragut St
- 519 S Niphon St
- 205 E Sheridan St
- 626 S Monitor St
- 301 W Pine St
- 402 W Pine St
- 2235 K Rd
- 2416 F Rd
- 1225 Co Road 1
- TBD Oakland
- 328 N Oakland Ave
- 206 N Thomas Ave
- 108 N Thomas Ave