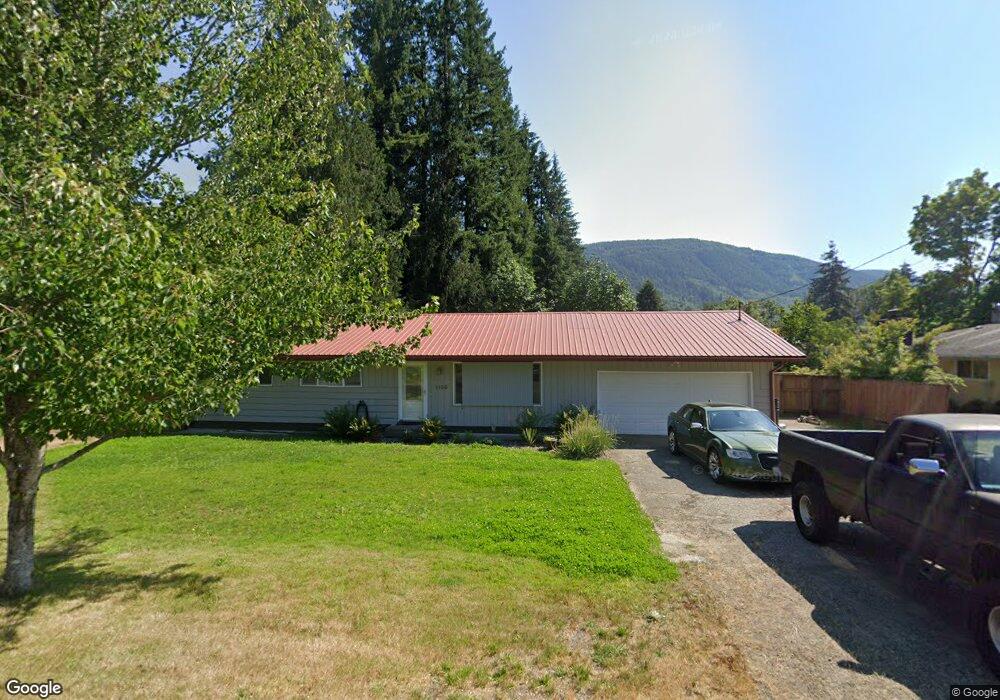
1155 Tilton Way Morton, WA 98356
Estimated Value: $369,470 - $436,000
3
Beds
3
Baths
1,480
Sq Ft
$272/Sq Ft
Est. Value
About This Home
This home is located at 1155 Tilton Way, Morton, WA 98356 and is currently estimated at $402,368, approximately $271 per square foot. 1155 Tilton Way is a home located in Lewis County with nearby schools including Morton Elementary School and Morton Junior/Senior High School.
Ownership History
Date
Name
Owned For
Owner Type
Purchase Details
Closed on
Aug 18, 2005
Sold by
Lindquist Victor R and Lindquist Gloria E
Bought by
Bennett Jayson L and Loomis Bennett Kimberly Ann
Current Estimated Value
Home Financials for this Owner
Home Financials are based on the most recent Mortgage that was taken out on this home.
Original Mortgage
$120,000
Outstanding Balance
$62,835
Interest Rate
5.61%
Mortgage Type
New Conventional
Estimated Equity
$339,533
Create a Home Valuation Report for This Property
The Home Valuation Report is an in-depth analysis detailing your home's value as well as a comparison with similar homes in the area
Home Values in the Area
Average Home Value in this Area
Purchase History
| Date | Buyer | Sale Price | Title Company |
|---|---|---|---|
| Bennett Jayson L | -- | Title Guranty |
Source: Public Records
Mortgage History
| Date | Status | Borrower | Loan Amount |
|---|---|---|---|
| Open | Bennett Jayson L | $120,000 |
Source: Public Records
Tax History Compared to Growth
Tax History
| Year | Tax Paid | Tax Assessment Tax Assessment Total Assessment is a certain percentage of the fair market value that is determined by local assessors to be the total taxable value of land and additions on the property. | Land | Improvement |
|---|---|---|---|---|
| 2025 | $2,171 | $359,000 | $79,500 | $279,500 |
| 2024 | $2,171 | $339,500 | $60,000 | $279,500 |
| 2023 | $2,435 | $350,300 | $60,000 | $290,300 |
| 2022 | $2,233 | $260,600 | $46,100 | $214,500 |
| 2021 | $2,086 | $260,600 | $46,100 | $214,500 |
| 2020 | $1,790 | $201,800 | $35,400 | $166,400 |
| 2019 | $1,452 | $177,300 | $30,900 | $146,400 |
| 2018 | $1,537 | $150,800 | $26,600 | $124,200 |
| 2017 | $1,432 | $142,300 | $26,600 | $115,700 |
| 2016 | $1,449 | $140,000 | $26,600 | $113,400 |
| 2015 | $1,595 | $141,400 | $28,000 | $113,400 |
| 2013 | $1,595 | $149,000 | $28,800 | $120,200 |
Source: Public Records
Map
Nearby Homes
- 121 Pleasant View Dr
- 5664 State 508
- 841 W Main Ave
- 725 W Main Ave
- 126 Chapman Rd
- 591 Division Ave
- 254 5th St
- 284 Division Ave
- 178 Owl Creek Ln
- 325 3rd St
- 161 1st St
- 102 Adams Ave
- 183 Wood Ave
- 168 Wood Ave
- 145 Collar Ave
- 0 Compton Rd
- 426 Highland Valley Rd
- 0 0 Highland Valley Rd
- 681 State Route 7
- 124 Highland Valley Rd