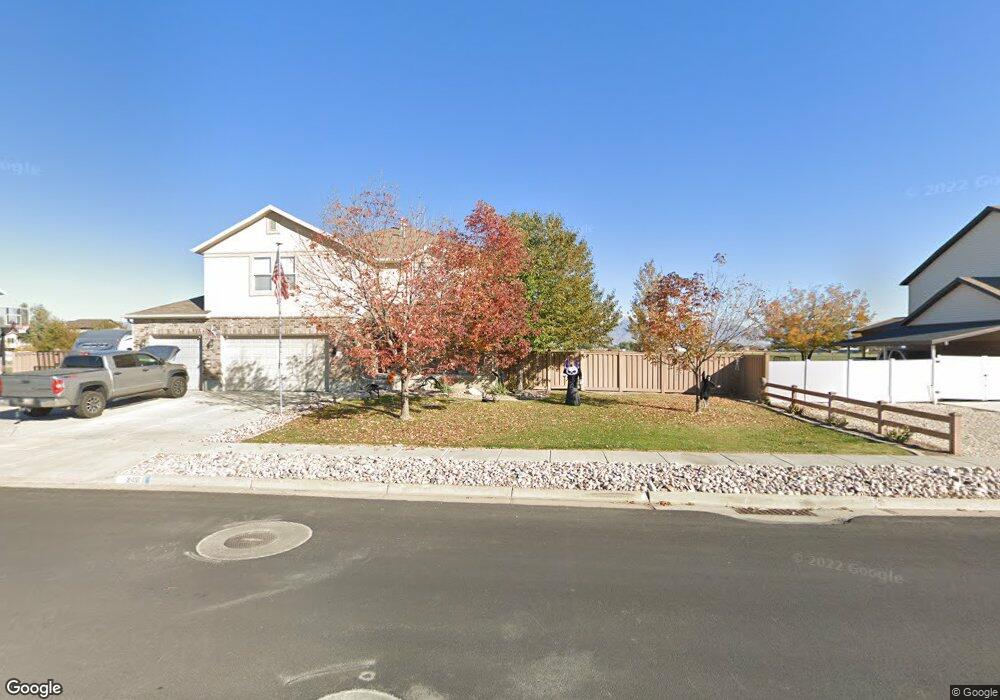
1155 W 2500 S Syracuse, UT 84075
Estimated Value: $720,000 - $766,000
6
Beds
5
Baths
3,915
Sq Ft
$191/Sq Ft
Est. Value
About This Home
This home is located at 1155 W 2500 S, Syracuse, UT 84075 and is currently estimated at $747,065, approximately $190 per square foot. 1155 W 2500 S is a home located in Davis County with nearby schools including Bluff Ridge Elementary, Legacy Junior High School, and Clearfield High School.
Ownership History
Date
Name
Owned For
Owner Type
Purchase Details
Closed on
Jul 30, 2014
Sold by
Wilkes Bruce Sheldon and Wilkes Lynette Madsen
Bought by
Cheney Jerrod R and Cheney Olga
Current Estimated Value
Home Financials for this Owner
Home Financials are based on the most recent Mortgage that was taken out on this home.
Original Mortgage
$284,798
Outstanding Balance
$213,549
Interest Rate
3.75%
Mortgage Type
FHA
Estimated Equity
$533,516
Purchase Details
Closed on
Sep 29, 1997
Sold by
Vankomen R H
Bought by
Wilkes Bruce Sheldon and Wilkes Lynette Madsen
Home Financials for this Owner
Home Financials are based on the most recent Mortgage that was taken out on this home.
Original Mortgage
$131,000
Interest Rate
7.54%
Purchase Details
Closed on
Mar 11, 1997
Sold by
Jade Development Lc
Bought by
Vankomen R H
Home Financials for this Owner
Home Financials are based on the most recent Mortgage that was taken out on this home.
Original Mortgage
$167,250
Interest Rate
7.74%
Mortgage Type
Construction
Create a Home Valuation Report for This Property
The Home Valuation Report is an in-depth analysis detailing your home's value as well as a comparison with similar homes in the area
Home Values in the Area
Average Home Value in this Area
Purchase History
| Date | Buyer | Sale Price | Title Company |
|---|---|---|---|
| Cheney Jerrod R | -- | Mountain View Title | |
| Wilkes Bruce Sheldon | -- | Bonneville Title Company Inc | |
| Vankomen R H | -- | Bonneville Title Company Inc |
Source: Public Records
Mortgage History
| Date | Status | Borrower | Loan Amount |
|---|---|---|---|
| Open | Cheney Jerrod R | $284,798 | |
| Previous Owner | Wilkes Bruce Sheldon | $131,000 | |
| Previous Owner | Vankomen R H | $167,250 | |
| Closed | Vankomen R H | $9,163 |
Source: Public Records
Tax History Compared to Growth
Tax History
| Year | Tax Paid | Tax Assessment Tax Assessment Total Assessment is a certain percentage of the fair market value that is determined by local assessors to be the total taxable value of land and additions on the property. | Land | Improvement |
|---|---|---|---|---|
| 2025 | $4,036 | $389,400 | $129,005 | $260,395 |
| 2024 | $3,981 | $386,650 | $110,670 | $275,980 |
| 2023 | $3,644 | $645,000 | $153,973 | $491,027 |
| 2022 | $3,452 | $334,950 | $88,080 | $246,870 |
| 2021 | $2,923 | $439,000 | $130,620 | $308,380 |
| 2020 | $2,723 | $396,000 | $111,779 | $284,221 |
| 2019 | $2,633 | $378,000 | $111,715 | $266,285 |
| 2018 | $2,639 | $376,000 | $106,567 | $269,433 |
| 2016 | $2,438 | $182,215 | $40,812 | $141,403 |
| 2015 | $2,616 | $186,175 | $40,812 | $145,363 |
| 2014 | $2,429 | $176,157 | $40,812 | $135,345 |
| 2013 | -- | $163,170 | $39,165 | $124,005 |
Source: Public Records
Map
Nearby Homes