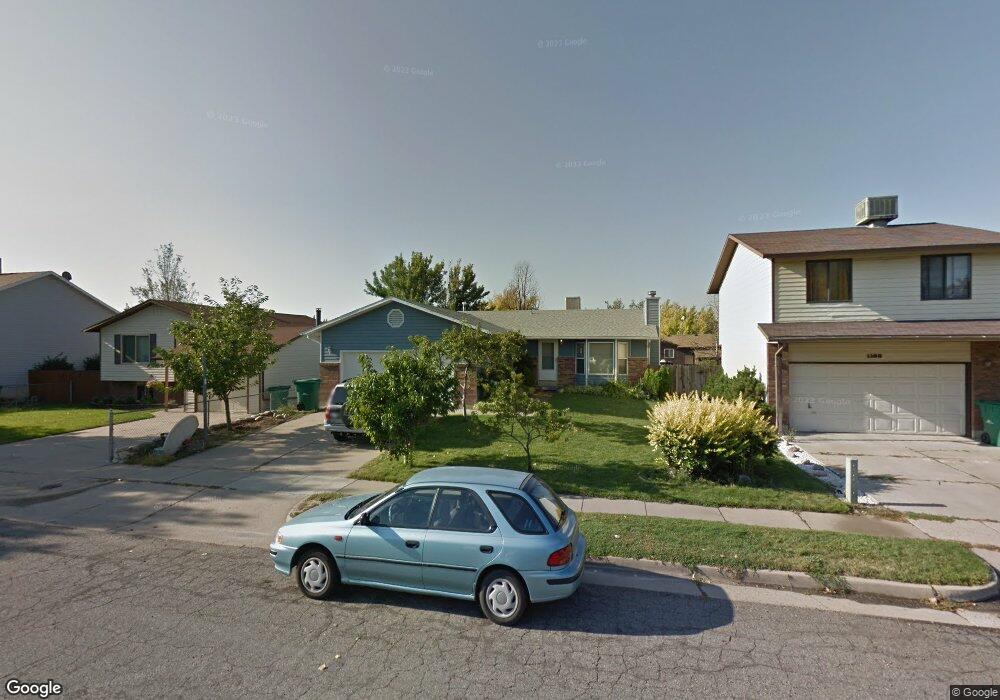
1155 W 2525 N Layton, UT 84041
Estimated Value: $412,000 - $444,579
4
Beds
2
Baths
1,948
Sq Ft
$221/Sq Ft
Est. Value
About This Home
This home is located at 1155 W 2525 N, Layton, UT 84041 and is currently estimated at $431,395, approximately $221 per square foot. 1155 W 2525 N is a home located in Davis County with nearby schools including Lincoln Elementary School, North Layton Junior High School, and Northridge High School.
Ownership History
Date
Name
Owned For
Owner Type
Purchase Details
Closed on
Nov 14, 2002
Sold by
Jeffery Ryan C and Jeffery Nancy O
Bought by
Forbes John Henry and Forbes Patricia S
Current Estimated Value
Home Financials for this Owner
Home Financials are based on the most recent Mortgage that was taken out on this home.
Original Mortgage
$133,797
Outstanding Balance
$55,753
Interest Rate
5.95%
Mortgage Type
VA
Estimated Equity
$375,642
Purchase Details
Closed on
Sep 27, 1996
Sold by
Ivory & Company
Bought by
Adams Steven D and Adams Lori
Home Financials for this Owner
Home Financials are based on the most recent Mortgage that was taken out on this home.
Original Mortgage
$114,823
Interest Rate
7.87%
Mortgage Type
FHA
Purchase Details
Closed on
Sep 23, 1996
Sold by
Adams Steven D and Adams Lori
Bought by
Jeffery Ryan C and Jeffery Nancy O
Home Financials for this Owner
Home Financials are based on the most recent Mortgage that was taken out on this home.
Original Mortgage
$114,823
Interest Rate
7.87%
Mortgage Type
FHA
Create a Home Valuation Report for This Property
The Home Valuation Report is an in-depth analysis detailing your home's value as well as a comparison with similar homes in the area
Home Values in the Area
Average Home Value in this Area
Purchase History
| Date | Buyer | Sale Price | Title Company |
|---|---|---|---|
| Forbes John Henry | -- | Bonneville Title Company Inc | |
| Adams Steven D | -- | First American Title Co | |
| Jeffery Ryan C | -- | First American Title Co |
Source: Public Records
Mortgage History
| Date | Status | Borrower | Loan Amount |
|---|---|---|---|
| Open | Forbes John Henry | $133,797 | |
| Previous Owner | Jeffery Ryan C | $114,823 |
Source: Public Records
Tax History Compared to Growth
Tax History
| Year | Tax Paid | Tax Assessment Tax Assessment Total Assessment is a certain percentage of the fair market value that is determined by local assessors to be the total taxable value of land and additions on the property. | Land | Improvement |
|---|---|---|---|---|
| 2024 | -- | $218,900 | $102,610 | $116,290 |
| 2023 | $2,082 | $388,000 | $129,836 | $258,164 |
| 2022 | $2,152 | $217,800 | $66,274 | $151,526 |
| 2021 | $1,915 | $289,000 | $86,997 | $202,003 |
| 2020 | $1,733 | $251,000 | $75,671 | $175,329 |
| 2019 | $1,749 | $248,000 | $74,193 | $173,807 |
| 2018 | $1,566 | $223,000 | $74,193 | $148,807 |
| 2016 | $1,394 | $102,410 | $22,084 | $80,326 |
| 2015 | $1,309 | $91,300 | $22,084 | $69,216 |
| 2014 | $1,274 | $90,813 | $22,084 | $68,729 |
| 2013 | -- | $82,914 | $20,680 | $62,234 |
Source: Public Records
Map
Nearby Homes
- 2887 N 1175 W
- 2949 N 1175 W
- 2402 N 725 W
- 850 S 1650 E Unit D
- 1548 E 925 S
- 2378 N 675 W
- 781 W 2150 N
- 709 W Highway 193
- 2211 N 525 W
- 2248 N 500 W
- 1606 W 1960 N
- 2875 N Hill Field Rd Unit 58
- 2875 N Hill Field Rd Unit 17
- 2875 N Hill Field Rd Unit 62
- 1208 Valhalla Dr
- 2187 N 450 W
- 1665 W 1960 N
- 1900 N 1690 W
- 65 Sunset Dr
- 63 Sunset Dr
- 1165 W 2525 N
- 1147 W 2525 N
- 1180 W 2450 N
- 1170 W 2450 N
- 1137 W 2525 N
- 2480 University Park Blvd
- 1164 W 2450 N
- 2460 University Park Blvd
- 1177 W 2525 N
- 2548 N 1150 W
- 1127 W 2525 N
- 2510 University Park Blvd
- 2510 N 1200 W
- 1154 W 2450 N
- 2553 N 1150 W
- 1134 W 2525 N
- 2560 N Angel St
- 1178 W 2525 N
- 1144 W 2450 N
- 1117 W 2525 N