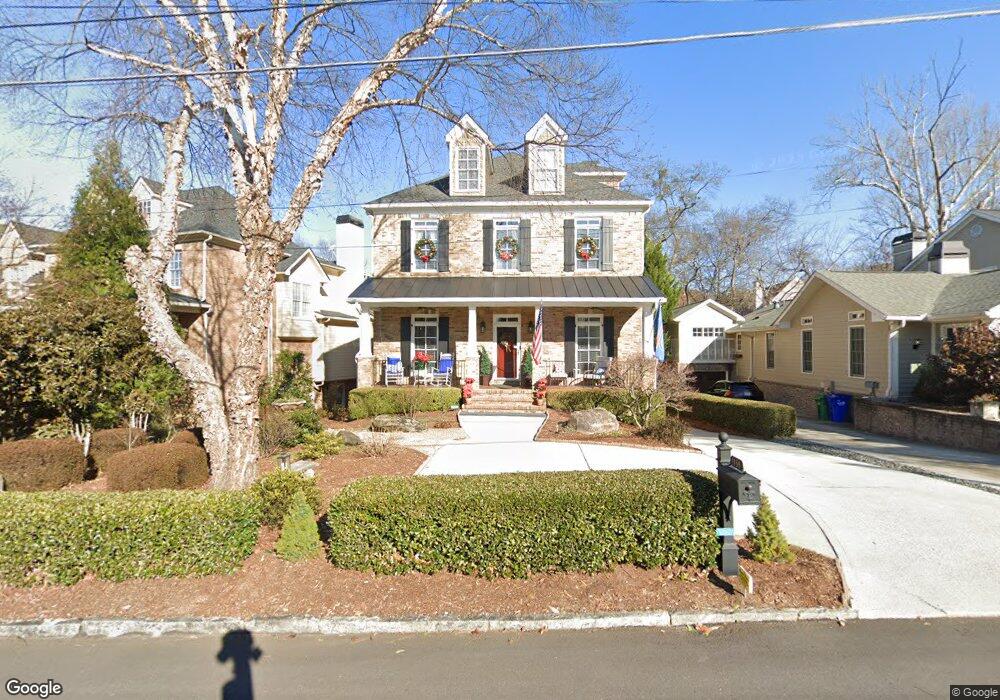
1156 Oglethorpe Ave NE Atlanta, GA 30319
Lenox Park NeighborhoodEstimated Value: $1,169,107 - $1,419,000
4
Beds
5
Baths
4,070
Sq Ft
$318/Sq Ft
Est. Value
About This Home
This home is located at 1156 Oglethorpe Ave NE, Atlanta, GA 30319 and is currently estimated at $1,294,027, approximately $317 per square foot. 1156 Oglethorpe Ave NE is a home located in DeKalb County with nearby schools including Woodward Elementary School, Sequoyah Middle School, and Cross Keys High School.
Ownership History
Date
Name
Owned For
Owner Type
Purchase Details
Closed on
Nov 29, 2005
Sold by
Dolan Frank and Dolan Joslyn
Bought by
Pries William T and Pries Brenda L
Current Estimated Value
Home Financials for this Owner
Home Financials are based on the most recent Mortgage that was taken out on this home.
Original Mortgage
$640,000
Outstanding Balance
$349,810
Interest Rate
6%
Mortgage Type
New Conventional
Estimated Equity
$944,217
Purchase Details
Closed on
Nov 16, 2001
Sold by
Dogwood Homes Llc
Bought by
Dolan Frank and Dolan Joslyn
Home Financials for this Owner
Home Financials are based on the most recent Mortgage that was taken out on this home.
Original Mortgage
$468,071
Interest Rate
5.88%
Mortgage Type
New Conventional
Create a Home Valuation Report for This Property
The Home Valuation Report is an in-depth analysis detailing your home's value as well as a comparison with similar homes in the area
Home Values in the Area
Average Home Value in this Area
Purchase History
| Date | Buyer | Sale Price | Title Company |
|---|---|---|---|
| Pries William T | $800,000 | -- | |
| Dolan Frank | $585,100 | -- |
Source: Public Records
Mortgage History
| Date | Status | Borrower | Loan Amount |
|---|---|---|---|
| Open | Pries William T | $640,000 | |
| Previous Owner | Dolan Frank | $468,071 |
Source: Public Records
Tax History Compared to Growth
Tax History
| Year | Tax Paid | Tax Assessment Tax Assessment Total Assessment is a certain percentage of the fair market value that is determined by local assessors to be the total taxable value of land and additions on the property. | Land | Improvement |
|---|---|---|---|---|
| 2025 | $2,020 | $441,400 | $80,000 | $361,400 |
| 2024 | $1,651 | $390,360 | $80,000 | $310,360 |
| 2023 | $1,651 | $343,560 | $79,019 | $264,541 |
| 2022 | $9,723 | $343,560 | $79,019 | $264,541 |
| 2021 | $7,903 | $343,560 | $80,000 | $263,560 |
| 2020 | $8,089 | $268,000 | $83,080 | $184,920 |
| 2019 | $7,984 | $268,000 | $83,080 | $184,920 |
| 2018 | $7,524 | $270,440 | $82,200 | $188,240 |
| 2017 | $8,643 | $257,792 | $77,338 | $180,454 |
| 2016 | $8,392 | $257,792 | $77,338 | $180,454 |
| 2014 | $7,920 | $237,640 | $82,040 | $155,600 |
Source: Public Records
Map
Nearby Homes
- 1160 Thornwell Dr NE
- 1303 N Druid Hills Rd NE
- 1120 Standard Dr NE
- 2322 Valley Brook Way NE
- 1270 Briarwood Rd NE
- 1242 Star Dr NE
- 1070 Standard Dr NE
- 1065 Arbor Trace NE
- 2348 Logan Cir NE
- 1048 Standard Dr NE
- 2240 Crestview Dr NE
- 1055 Dryden Ln Unit 10
- 3777 Peachtree Rd NE Unit 1338
- 3777 Peachtree Rd NE Unit 1324
- 3777 Peachtree Rd NE Unit 632
- 3777 Peachtree Rd NE Unit 1416
- 3777 Peachtree Rd NE Unit 1211
- 3777 Peachtree Rd NE Unit 1108
- 3777 Peachtree Rd NE Unit 932
- 3777 Peachtree Rd NE Unit 1632
- 1160 Oglethorpe Ave NE
- 1150 Oglethorpe Ave NE
- 1164 Oglethorpe Ave NE
- 1140 Oglethorpe Ave NE
- 1168 Oglethorpe Ave NE
- 1159 Thornwell Dr NE
- 1132 Oglethorpe Ave NE
- 1153 Thornwell Dr NE
- 1163 Thornwell Dr NE
- 1126 Oglethorpe Ave NE
- 1174 Oglethorpe Ave NE
- 1167 Thornwell Dr NE
- 1153 Oglethorpe Ave NE
- 1157 Oglethorpe Ave NE
- 1161 Oglethorpe Ave NE
- 1151 Oglethorpe Ave NE
- 1149 Thornwell Dr NE
- 1147 Oglethorpe Ave NE
- 2373 Colonial Dr NE
- 1137 Oglethorpe Ave NE