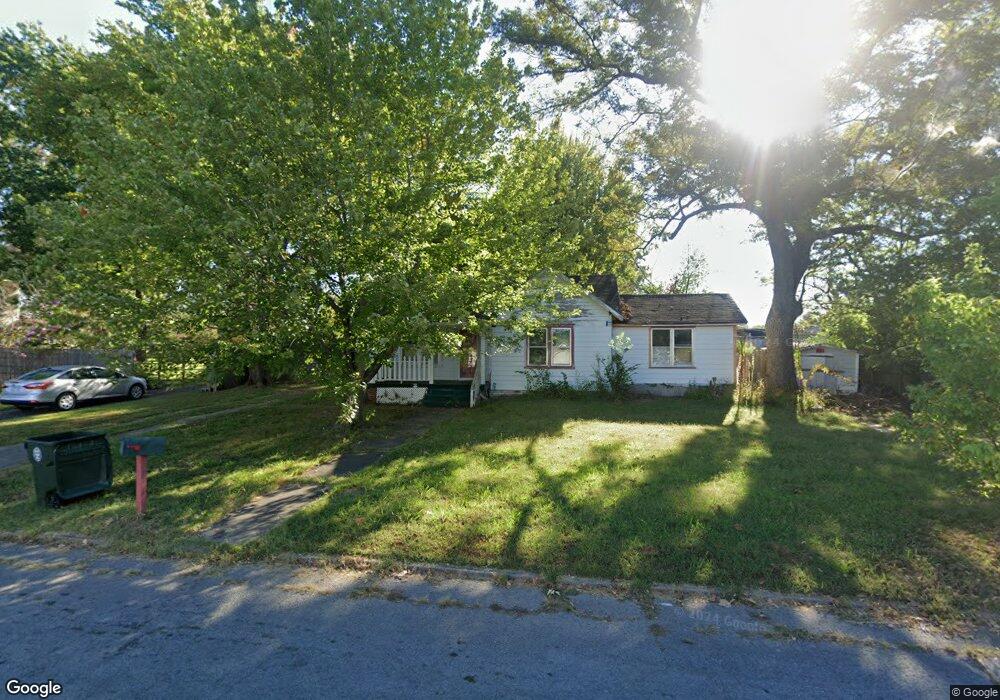
1156 Summit St Muskogee, OK 74403
Central Muskogee NeighborhoodEstimated Value: $62,000 - $137,000
3
Beds
1
Bath
1,181
Sq Ft
$75/Sq Ft
Est. Value
About This Home
This home is located at 1156 Summit St, Muskogee, OK 74403 and is currently estimated at $88,664, approximately $75 per square foot. 1156 Summit St is a home located in Muskogee County with nearby schools including Irving Elementary School, 8th & 9th Grade Academy @ Alice Robertson, and Muskogee High School.
Ownership History
Date
Name
Owned For
Owner Type
Purchase Details
Closed on
Dec 12, 2022
Sold by
Obrien Brenda Diane
Bought by
Genoves Pablo Alfonso Rodr and Andrade Martha Aguilar
Current Estimated Value
Purchase Details
Closed on
May 22, 2020
Sold by
U S Bank Natijonal Association
Bought by
Obrien Brenda Diane
Purchase Details
Closed on
Jan 14, 2019
Sold by
Garrett Roy L
Bought by
U S Bank National Asociation
Purchase Details
Closed on
Dec 8, 2003
Bought by
Garrett Roy L
Purchase Details
Closed on
Feb 18, 1997
Create a Home Valuation Report for This Property
The Home Valuation Report is an in-depth analysis detailing your home's value as well as a comparison with similar homes in the area
Home Values in the Area
Average Home Value in this Area
Purchase History
| Date | Buyer | Sale Price | Title Company |
|---|---|---|---|
| Genoves Pablo Alfonso Rodr | -- | -- | |
| Obrien Brenda Diane | $7,501 | Oklahoma Land Title Svcs Llc | |
| U S Bank National Asociation | $25,534 | None Available | |
| Garrett Roy L | $35,000 | -- | |
| -- | $26,500 | -- |
Source: Public Records
Tax History Compared to Growth
Tax History
| Year | Tax Paid | Tax Assessment Tax Assessment Total Assessment is a certain percentage of the fair market value that is determined by local assessors to be the total taxable value of land and additions on the property. | Land | Improvement |
|---|---|---|---|---|
| 2024 | $554 | $5,082 | $693 | $4,389 |
| 2023 | $554 | $2,299 | $416 | $1,883 |
| 2022 | $229 | $2,299 | $416 | $1,883 |
| 2021 | $363 | $3,628 | $407 | $3,221 |
| 2020 | $263 | $3,628 | $407 | $3,221 |
| 2019 | $261 | $3,628 | $407 | $3,221 |
| 2018 | $256 | $3,628 | $407 | $3,221 |
| 2017 | $247 | $3,628 | $407 | $3,221 |
| 2016 | $284 | $3,980 | $407 | $3,573 |
| 2015 | $281 | $3,980 | $407 | $3,573 |
| 2014 | $286 | $3,980 | $407 | $3,573 |
Source: Public Records
Map
Nearby Homes