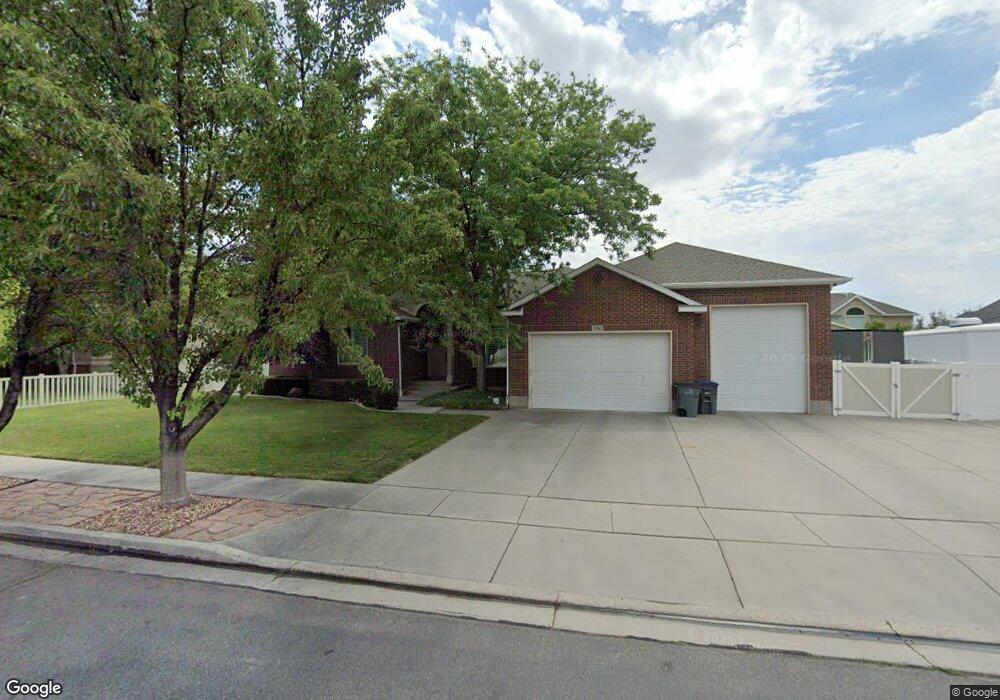
11561 Cross Country Cir South Jordan, UT 84095
Daybreak NeighborhoodEstimated Value: $763,000 - $806,511
4
Beds
3
Baths
3,934
Sq Ft
$201/Sq Ft
Est. Value
About This Home
This home is located at 11561 Cross Country Cir, South Jordan, UT 84095 and is currently estimated at $791,378, approximately $201 per square foot. 11561 Cross Country Cir is a home located in Salt Lake County with nearby schools including Daybreak Elementary School, Mountain Creek Middle School, and Herriman High School.
Ownership History
Date
Name
Owned For
Owner Type
Purchase Details
Closed on
Oct 18, 2022
Sold by
Foreman Les G and Foreman Naomi D
Bought by
Foreman Living Trust
Current Estimated Value
Purchase Details
Closed on
Sep 18, 2002
Sold by
Dawson Brandon
Bought by
Foreman Les G and Foreman Naomi D
Home Financials for this Owner
Home Financials are based on the most recent Mortgage that was taken out on this home.
Original Mortgage
$249,300
Interest Rate
5.25%
Purchase Details
Closed on
Jul 14, 2000
Sold by
Dawson Brandon and Dawson Stephanie
Bought by
Dawson Brandon
Home Financials for this Owner
Home Financials are based on the most recent Mortgage that was taken out on this home.
Original Mortgage
$224,000
Interest Rate
8.55%
Purchase Details
Closed on
Oct 19, 1999
Sold by
Rdm Construction
Bought by
Dawson Brandon and Dawson Stephanie
Create a Home Valuation Report for This Property
The Home Valuation Report is an in-depth analysis detailing your home's value as well as a comparison with similar homes in the area
Home Values in the Area
Average Home Value in this Area
Purchase History
| Date | Buyer | Sale Price | Title Company |
|---|---|---|---|
| Foreman Living Trust | -- | -- | |
| Foreman Les G | -- | Equity Title | |
| Dawson Brandon | -- | Backman Stewart Title Servic | |
| Dawson Brandon | -- | Meridian Title |
Source: Public Records
Mortgage History
| Date | Status | Borrower | Loan Amount |
|---|---|---|---|
| Previous Owner | Foreman Les G | $249,300 | |
| Previous Owner | Dawson Brandon | $224,000 |
Source: Public Records
Tax History Compared to Growth
Tax History
| Year | Tax Paid | Tax Assessment Tax Assessment Total Assessment is a certain percentage of the fair market value that is determined by local assessors to be the total taxable value of land and additions on the property. | Land | Improvement |
|---|---|---|---|---|
| 2025 | -- | $747,700 | $209,600 | $538,100 |
| 2024 | -- | $730,900 | $203,600 | $527,300 |
| 2023 | $3,908 | $700,100 | $195,700 | $504,400 |
| 2022 | $4,077 | $715,900 | $191,900 | $524,000 |
| 2021 | $3,404 | $548,400 | $133,300 | $415,100 |
| 2020 | $3,116 | $470,600 | $113,100 | $357,500 |
| 2019 | $3,145 | $466,900 | $113,100 | $353,800 |
| 2018 | $2,972 | $439,000 | $110,700 | $328,300 |
| 2017 | $2,831 | $409,800 | $110,700 | $299,100 |
| 2016 | $2,796 | $383,500 | $110,700 | $272,800 |
| 2015 | $2,665 | $355,400 | $112,800 | $242,600 |
| 2014 | $2,557 | $335,100 | $107,600 | $227,500 |
Source: Public Records
Map
Nearby Homes
- 4144 W Foxview Dr
- 11777 S 4210 W
- 4347 W 11770 S
- 11491 Harvest Crest Way
- 4463 W Harvest Sun Ln
- 4454 W 11800 S
- 4466 W 11800 S
- 4536 W Silent Rain Dr
- 11851 S Graycliff Rd
- 4555 W Open Hill Dr
- 4491 W Daybreak Rim Way
- 11347 S Kestrel Rise Rd
- 4584 W Daybreak Rim Way
- 4586 W Daybreak Rim Way Unit 396
- 4629 W Daybreak Rim Way
- 4563 W Daybreak Pkwy
- 11078 Topview Rd
- 11061 S Indigo Sky Way
- 11381 Skylux Ave
- 11211 S Clear Blue Dr
- 11547 Cross Country Cir
- 11579 Cross Country Cir
- 11579 S Cross Country Cir
- 11566 Country Crossing Rd
- 11582 Country Crossing Rd
- 11564 Cross Country Cir
- 11552 S Country Crossing Rd
- 11552 Country Crossing Rd
- 11548 Cross Country Cir
- 11578 S Cross Country Cir
- 11578 Cross Country Cir
- 11531 Cross Country Cir
- 11532 S Cross Country Cir
- 11532 Cross Country Cir
- 11561 S Country Farm Cir
- 11561 Country Farm Cir
- 11545 Country Farm Cir
- 4237 W 11595 S
- 11545 S Country Farm Cir
- 11571 Country Crossing Rd