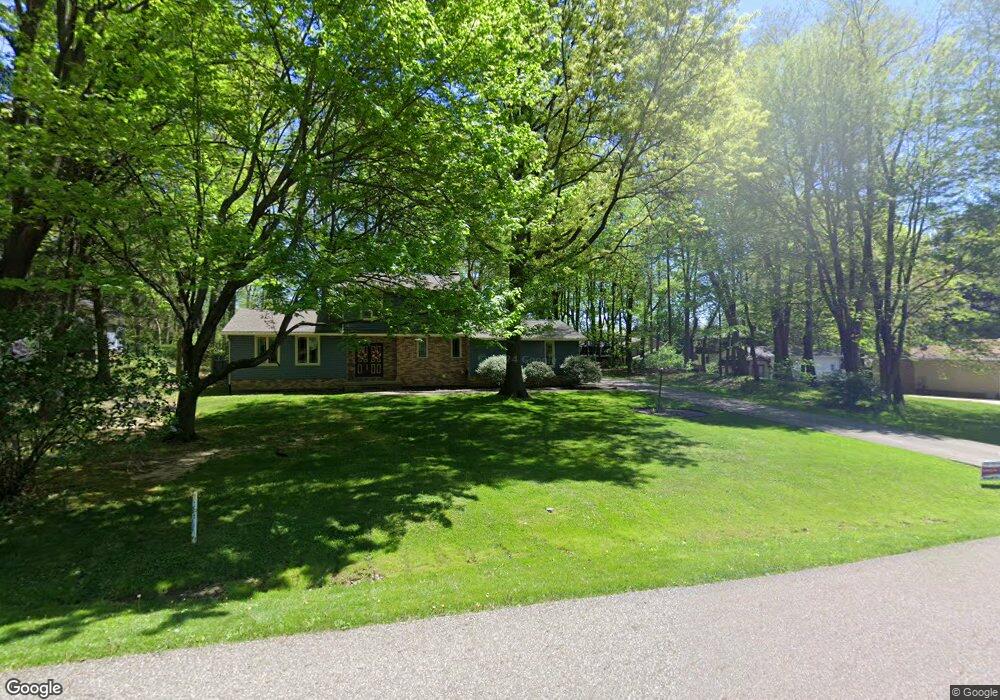
11566 Holbrook Ave NW Uniontown, OH 44685
Estimated Value: $292,351 - $336,000
3
Beds
2
Baths
1,774
Sq Ft
$176/Sq Ft
Est. Value
About This Home
This home is located at 11566 Holbrook Ave NW, Uniontown, OH 44685 and is currently estimated at $311,838, approximately $175 per square foot. 11566 Holbrook Ave NW is a home located in Stark County with nearby schools including Lake Middle/High School, Lake Center Christian School, and Mayfair Christian School.
Ownership History
Date
Name
Owned For
Owner Type
Purchase Details
Closed on
Apr 17, 2014
Sold by
Peters Scott E and Peters Stacey M
Bought by
Neidert Aaron J and Neidert Joy E
Current Estimated Value
Home Financials for this Owner
Home Financials are based on the most recent Mortgage that was taken out on this home.
Original Mortgage
$149,625
Outstanding Balance
$113,614
Interest Rate
4.31%
Mortgage Type
New Conventional
Estimated Equity
$198,224
Purchase Details
Closed on
Jan 5, 2006
Sold by
Senters Sean E and Senters Dina L
Bought by
Peters Scott E and Peters Stacey M
Home Financials for this Owner
Home Financials are based on the most recent Mortgage that was taken out on this home.
Original Mortgage
$126,400
Interest Rate
6.24%
Mortgage Type
Purchase Money Mortgage
Purchase Details
Closed on
Feb 1, 2003
Sold by
Maclachlan Martha L
Bought by
Senters Sean E and Senters Dina L
Home Financials for this Owner
Home Financials are based on the most recent Mortgage that was taken out on this home.
Original Mortgage
$108,000
Interest Rate
6.06%
Mortgage Type
Purchase Money Mortgage
Create a Home Valuation Report for This Property
The Home Valuation Report is an in-depth analysis detailing your home's value as well as a comparison with similar homes in the area
Home Values in the Area
Average Home Value in this Area
Purchase History
| Date | Buyer | Sale Price | Title Company |
|---|---|---|---|
| Neidert Aaron J | $157,500 | Patriot Title Agency Inc | |
| Peters Scott E | $158,000 | Lawyers Title | |
| Senters Sean E | $135,000 | -- |
Source: Public Records
Mortgage History
| Date | Status | Borrower | Loan Amount |
|---|---|---|---|
| Open | Neidert Aaron J | $149,625 | |
| Closed | Peters Scott E | $126,400 | |
| Closed | Senters Sean E | $108,000 | |
| Closed | Senters Sean E | $27,000 |
Source: Public Records
Tax History Compared to Growth
Tax History
| Year | Tax Paid | Tax Assessment Tax Assessment Total Assessment is a certain percentage of the fair market value that is determined by local assessors to be the total taxable value of land and additions on the property. | Land | Improvement |
|---|---|---|---|---|
| 2025 | -- | $94,360 | $26,530 | $67,830 |
| 2024 | -- | $94,360 | $26,530 | $67,830 |
| 2023 | $2,991 | $58,700 | $15,790 | $42,910 |
| 2022 | $3,002 | $58,700 | $15,790 | $42,910 |
| 2021 | $3,034 | $58,700 | $15,790 | $42,910 |
| 2020 | $2,952 | $51,040 | $13,620 | $37,420 |
| 2019 | $2,928 | $51,040 | $13,620 | $37,420 |
| 2018 | $2,931 | $51,040 | $13,620 | $37,420 |
| 2017 | $2,820 | $45,440 | $12,150 | $33,290 |
| 2016 | $2,826 | $45,440 | $12,150 | $33,290 |
| 2015 | $2,825 | $45,440 | $12,150 | $33,290 |
| 2014 | $394 | $39,590 | $10,570 | $29,020 |
| 2013 | $1,172 | $38,780 | $10,570 | $28,210 |
Source: Public Records
Map
Nearby Homes
- 0 Heckman St NW Unit 5170555
- 11316 Cleveland Ave NW
- 2601 Lake Center St NW
- 3648 Mulberry St NW
- 12235 Cantburg Ave NW
- 3863 Heckman St NW
- 3851 Cromford Cir NW
- 11056 Peach Glen Ave NW
- 10531 Newbury Ave NW
- 843 Brodie Ct
- 835 Brodie Ct
- 11065 Dunsby Ave NW
- 12494 Bridgemont Ave NW
- 3048 Wright Rd NW
- 3026 Wright Rd NW
- 2490 Ledgestone Dr NW
- 2334 Ledgestone Dr NW
- 2244 Ledgestone Dr NW
- 2316 Ledgestone Dr NW
- 2693 Ledgestone Dr NW
- 11580 Holbrook Ave NW
- 11540 Holbrook Ave NW
- 3029 Hampton St NW
- 11600 Holbrook Ave NW
- 3011 Hampton St NW
- 11567 Holbrook Ave NW
- 11620 Holbrook Ave NW
- 11611 Holbrook Ave NW
- 3105 Hampton St NW
- 3054 Hampton St NW
- 3064 Townsend St NW
- 3036 Hampton St NW
- 3074 Hampton St NW
- 3060 Townsend St NW
- 3125 Hampton St NW
- 3014 Hampton St NW
- 11539 Mogadore Ave NW
- 3092 Hampton St NW
- 3116 Townsend St NW
- 11580 Whitehall Ave NW