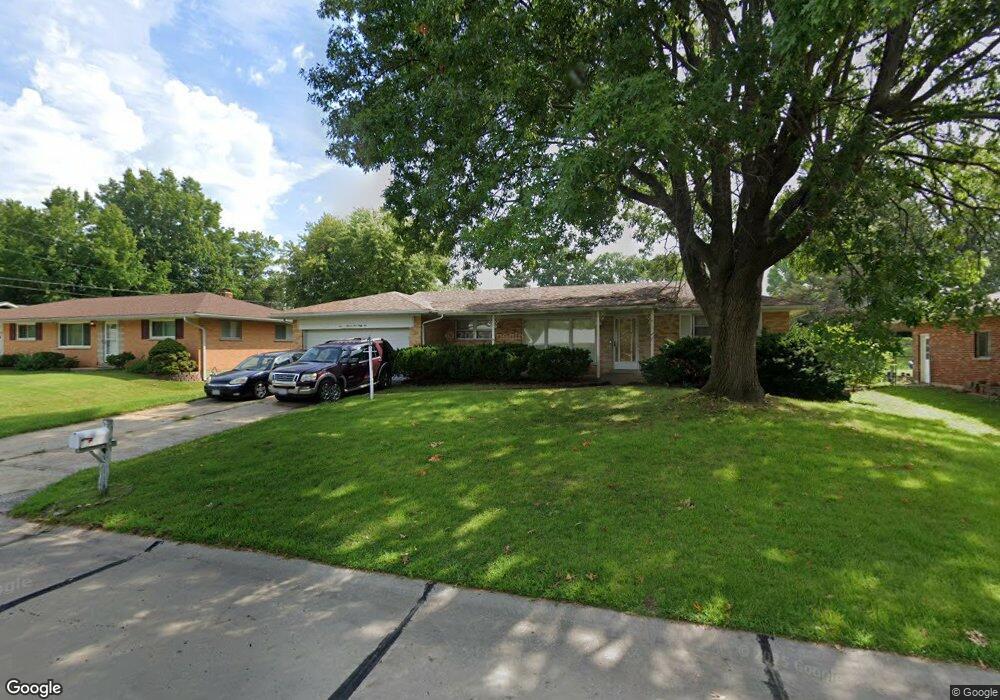
11566 Poggemoeller Ave Saint Louis, MO 63138
Estimated Value: $135,000 - $163,000
3
Beds
2
Baths
1,144
Sq Ft
$132/Sq Ft
Est. Value
About This Home
This home is located at 11566 Poggemoeller Ave, Saint Louis, MO 63138 and is currently estimated at $151,423, approximately $132 per square foot. 11566 Poggemoeller Ave is a home located in St. Louis County with nearby schools including Grannemann Elementary School, Hazelwood East High School, and Salem Lutheran School.
Ownership History
Date
Name
Owned For
Owner Type
Purchase Details
Closed on
Feb 21, 2003
Sold by
Saaman Corp
Bought by
Mcgregor Sajorie C
Current Estimated Value
Home Financials for this Owner
Home Financials are based on the most recent Mortgage that was taken out on this home.
Original Mortgage
$99,900
Outstanding Balance
$42,722
Interest Rate
5.93%
Estimated Equity
$108,701
Purchase Details
Closed on
Nov 27, 2002
Sold by
Meyer Dorothy R
Bought by
Saaman Corp
Home Financials for this Owner
Home Financials are based on the most recent Mortgage that was taken out on this home.
Original Mortgage
$98,000
Interest Rate
6.05%
Purchase Details
Closed on
Jun 3, 2002
Sold by
Meyer Dorothy R
Bought by
Meyer Dorothy R and Dorothy R Meyer Revocable Trust
Purchase Details
Closed on
Jul 6, 1998
Sold by
Meyer Dorothy R
Bought by
The Dorothy R Meyer Revocable Living Tr
Create a Home Valuation Report for This Property
The Home Valuation Report is an in-depth analysis detailing your home's value as well as a comparison with similar homes in the area
Home Values in the Area
Average Home Value in this Area
Purchase History
| Date | Buyer | Sale Price | Title Company |
|---|---|---|---|
| Mcgregor Sajorie C | $99,900 | -- | |
| Saaman Corp | $70,000 | -- | |
| Meyer Dorothy R | -- | -- | |
| The Dorothy R Meyer Revocable Living Tr | -- | -- |
Source: Public Records
Mortgage History
| Date | Status | Borrower | Loan Amount |
|---|---|---|---|
| Open | Mcgregor Sajorie C | $99,900 | |
| Previous Owner | Saaman Corp | $98,000 |
Source: Public Records
Tax History Compared to Growth
Tax History
| Year | Tax Paid | Tax Assessment Tax Assessment Total Assessment is a certain percentage of the fair market value that is determined by local assessors to be the total taxable value of land and additions on the property. | Land | Improvement |
|---|---|---|---|---|
| 2025 | $2,544 | $28,020 | $2,770 | $25,250 |
| 2024 | $2,544 | $26,850 | $4,540 | $22,310 |
| 2023 | $2,482 | $26,850 | $4,540 | $22,310 |
| 2022 | $2,052 | $19,420 | $4,540 | $14,880 |
| 2021 | $2,022 | $19,420 | $4,540 | $14,880 |
| 2020 | $1,830 | $16,300 | $4,010 | $12,290 |
| 2019 | $1,754 | $16,300 | $4,010 | $12,290 |
| 2018 | $1,549 | $13,220 | $2,770 | $10,450 |
| 2017 | $1,543 | $13,220 | $2,770 | $10,450 |
| 2016 | $1,642 | $13,890 | $2,570 | $11,320 |
| 2015 | $1,609 | $13,890 | $2,570 | $11,320 |
| 2014 | -- | $14,990 | $3,400 | $11,590 |
Source: Public Records
Map
Nearby Homes
- 11550 Rock Hampton Dr
- 1912 Shardell Dr
- 11559 Asheboro Dr
- 1877 Claudine Dr
- 1928 Claudine Dr
- 2015 Claudine Dr
- 11519 Rosary Ln
- 1911 Redman Rd
- 1730 Parktree Ln
- 11377 Fox Hall Ln
- 11905 Rosevalley Ln
- 1635 Dunn Rd
- 2291 Redman Rd
- 11440 Sheffield Dr
- 11401 Northway Dr
- 11814 Bellefontaine Rd
- 1535 Twillman Ave
- 1516 Crossett Dr
- 1647 Talisman Ln
- 11757 Vizcuya Ct
- 11572 Poggemoeller Ave
- 11560 Poggemoeller Ave
- 11555 Rock Hampton Dr
- 11549 Rock Hampton Dr
- 11561 Rock Hampton Dr
- 11554 Poggemoeller Ave
- 1880 Shardell Dr
- 11565 Poggemoeller Ave
- 11559 Poggemoeller Ave
- 11543 Rock Hampton Dr
- 1870 Shardell Dr
- 1900 Shardell Dr
- 11553 Poggemoeller Ave
- 11548 Poggemoeller Ave
- 11537 Rock Hampton Dr
- 11556 Rock Hampton Dr
- 11560 Asheboro Dr
- 11562 Rock Hampton Dr
- 11566 Asheboro Dr