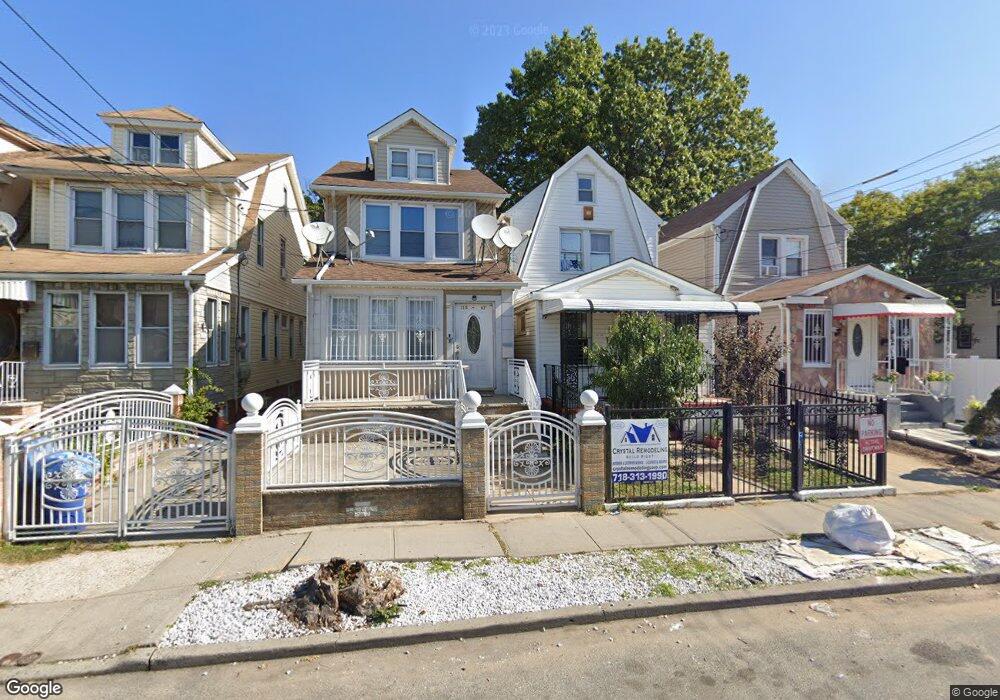
11569 155th St Jamaica, NY 11434
South Jamaica NeighborhoodEstimated Value: $522,000 - $653,000
--
Bed
--
Bath
952
Sq Ft
$614/Sq Ft
Est. Value
About This Home
This home is located at 11569 155th St, Jamaica, NY 11434 and is currently estimated at $584,432, approximately $613 per square foot. 11569 155th St is a home located in Queens County with nearby schools including P.S. 123, J.H.S. 226 Virgil I. Grisson, and Rochdale Early Advantage Charter School.
Ownership History
Date
Name
Owned For
Owner Type
Purchase Details
Closed on
Oct 25, 2017
Sold by
Bullock Kimberly
Bought by
Alabli Katibah and Al-Abli Sulaiman
Current Estimated Value
Purchase Details
Closed on
Jul 29, 2005
Sold by
Bullock Kimberly and Myers Lawrence
Bought by
Bullock Kimberly
Purchase Details
Closed on
Mar 17, 2003
Sold by
Myers Cecelia
Bought by
Bullock Kimberly and Myers Lawrence
Purchase Details
Closed on
Mar 3, 1999
Sold by
186 Dormans Inc
Bought by
Myers Cecelia
Home Financials for this Owner
Home Financials are based on the most recent Mortgage that was taken out on this home.
Original Mortgage
$137,159
Interest Rate
6.92%
Mortgage Type
FHA
Purchase Details
Closed on
Oct 22, 1997
Sold by
King Charles and King Marzine
Bought by
186 Dormans Corp
Create a Home Valuation Report for This Property
The Home Valuation Report is an in-depth analysis detailing your home's value as well as a comparison with similar homes in the area
Home Values in the Area
Average Home Value in this Area
Purchase History
| Date | Buyer | Sale Price | Title Company |
|---|---|---|---|
| Alabli Katibah | $337,000 | -- | |
| Alabli Katibah | $337,000 | -- | |
| Sulaiman Alabli Katibah | $337,000 | -- | |
| Bullock Kimberly | -- | -- | |
| Bullock Kimberly | -- | -- | |
| Bullock Kimberly | $175,000 | -- | |
| Bullock Kimberly | $175,000 | -- | |
| Myers Cecelia | $138,000 | -- | |
| Myers Cecelia | $138,000 | -- | |
| 186 Dormans Corp | $71,000 | Stewart Title Insurance Co | |
| 186 Dormans Corp | $71,000 | Stewart Title Insurance Co |
Source: Public Records
Mortgage History
| Date | Status | Borrower | Loan Amount |
|---|---|---|---|
| Previous Owner | Myers Cecelia | $137,159 | |
| Closed | Bullock Kimberly | $0 |
Source: Public Records
Tax History Compared to Growth
Tax History
| Year | Tax Paid | Tax Assessment Tax Assessment Total Assessment is a certain percentage of the fair market value that is determined by local assessors to be the total taxable value of land and additions on the property. | Land | Improvement |
|---|---|---|---|---|
| 2025 | $4,231 | $22,284 | $6,361 | $15,923 |
| 2024 | $4,231 | $21,067 | $6,332 | $14,735 |
| 2023 | $4,104 | $20,206 | $5,568 | $14,638 |
| 2022 | $3,862 | $31,980 | $9,540 | $22,440 |
| 2021 | $3,913 | $29,340 | $9,540 | $19,800 |
| 2020 | $3,931 | $26,040 | $9,540 | $16,500 |
| 2019 | $3,673 | $23,700 | $9,540 | $14,160 |
| 2018 | $3,432 | $16,838 | $6,374 | $10,464 |
| 2017 | $3,287 | $16,123 | $7,324 | $8,799 |
| 2016 | $3,097 | $16,123 | $7,324 | $8,799 |
| 2015 | $1,835 | $15,475 | $8,893 | $6,582 |
| 2014 | $1,835 | $14,630 | $8,574 | $6,056 |
Source: Public Records
Map
Nearby Homes
- 155-11 115th Dr
- 150-45 115th Dr
- 15516 115th Dr
- 15036 115th Dr
- 15042 116th Ave
- 15539 115th Dr
- 11547 Sutphin Blvd
- 155-18 116th Rd
- 155-54 115th Dr
- 15058 116th Rd
- 15036 114th Rd
- 150-22 114th Rd
- 150-16 114th Rd
- 115-36 157th St
- 115-32 149th St
- 11416 James Ct
- 153-02 Foch Blvd
- 114-18 157th St
- 15718 115th Rd Unit 2 Family
- 15070 Foch Blvd
- 11571 155th St
- 115-71 155th St
- 11567 155th St
- 11565 155th St
- 155-13 116th Ave
- 11563 155th St
- 15511 116th Ave
- 11561 155th St
- 155-15 116th Ave
- 11601 155th St
- 15513 116th Ave
- 11559 155th St
- 11603 155th St
- 115-69 155th St
- 15515 116th Ave
- 11557 155th St
- 11605 155th St
- 155-12 115th Dr
- 15512 115th Dr
- 15517 116th Ave