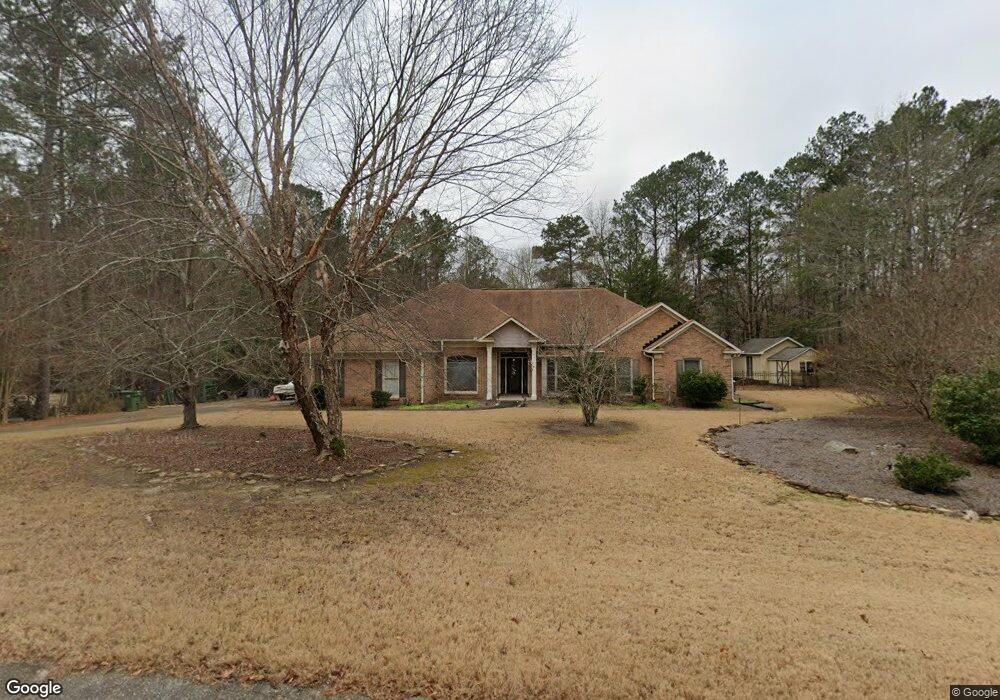
1157 Posey Ln Columbus, GA 31904
Northern Columbus NeighborhoodEstimated Value: $471,000 - $515,000
4
Beds
4
Baths
2,930
Sq Ft
$166/Sq Ft
Est. Value
About This Home
This home is located at 1157 Posey Ln, Columbus, GA 31904 and is currently estimated at $486,487, approximately $166 per square foot. 1157 Posey Ln is a home located in Muscogee County with nearby schools including Double Churches Elementary School, Veterans Memorial Middle School, and Northside High School.
Ownership History
Date
Name
Owned For
Owner Type
Purchase Details
Closed on
Feb 28, 2017
Sold by
Flowers Richard E
Bought by
Flowers Jennifer L
Current Estimated Value
Home Financials for this Owner
Home Financials are based on the most recent Mortgage that was taken out on this home.
Original Mortgage
$160,000
Outstanding Balance
$132,621
Interest Rate
4.24%
Mortgage Type
New Conventional
Estimated Equity
$353,866
Purchase Details
Closed on
Feb 21, 2017
Sold by
Flowers Jennifer L
Bought by
Flowers Richard E
Home Financials for this Owner
Home Financials are based on the most recent Mortgage that was taken out on this home.
Original Mortgage
$160,000
Outstanding Balance
$132,621
Interest Rate
4.24%
Mortgage Type
New Conventional
Estimated Equity
$353,866
Purchase Details
Closed on
Aug 1, 2008
Sold by
Flowers Richard E
Bought by
Flowers Jennifer L
Create a Home Valuation Report for This Property
The Home Valuation Report is an in-depth analysis detailing your home's value as well as a comparison with similar homes in the area
Home Values in the Area
Average Home Value in this Area
Purchase History
| Date | Buyer | Sale Price | Title Company |
|---|---|---|---|
| Flowers Jennifer L | $160,000 | -- | |
| Flowers Richard E | $325,000 | -- | |
| Flowers Jennifer L | -- | None Available |
Source: Public Records
Mortgage History
| Date | Status | Borrower | Loan Amount |
|---|---|---|---|
| Open | Flowers Richard E | $160,000 |
Source: Public Records
Tax History Compared to Growth
Tax History
| Year | Tax Paid | Tax Assessment Tax Assessment Total Assessment is a certain percentage of the fair market value that is determined by local assessors to be the total taxable value of land and additions on the property. | Land | Improvement |
|---|---|---|---|---|
| 2025 | $3,780 | $154,272 | $31,368 | $122,904 |
| 2024 | $3,779 | $154,272 | $31,368 | $122,904 |
| 2023 | $311 | $154,272 | $31,368 | $122,904 |
| 2022 | $3,942 | $125,472 | $31,368 | $94,104 |
| 2021 | $3,935 | $120,240 | $31,368 | $88,872 |
| 2020 | $3,936 | $120,240 | $31,368 | $88,872 |
| 2019 | $3,950 | $120,240 | $31,368 | $88,872 |
| 2018 | $3,950 | $120,240 | $31,368 | $88,872 |
| 2017 | $3,964 | $120,240 | $31,368 | $88,872 |
| 2016 | $3,980 | $129,117 | $15,752 | $113,365 |
| 2015 | $3,986 | $129,117 | $15,752 | $113,365 |
| 2014 | $3,993 | $129,117 | $15,752 | $113,365 |
| 2013 | -- | $129,117 | $15,752 | $113,365 |
Source: Public Records
Map
Nearby Homes
- 928 Heiferhorn Trace
- 8259 Lantern Ln
- 8344 Twin Chapel Dr
- 1058 Cedarbrook Dr
- 7841 Edgewater Dr
- 706 Moore Rd
- 609 Moore Rd
- 155 Hydrangea Rd
- 8935 A N Moore Rd
- 1579 Magnolia Way
- 7635 Edgewater Dr
- 7701 Gray Shoals Dr
- 517 Double Churches Rd
- 1535 Doubletree Dr
- 281 Zachary Ct
- 7170 Bridgemill Dr
- 5080 Hawks Ridge Dr
- 1727 Fountain Ct
- 8530 Lake Bright Dr
- 8531 Lake Bright Dr
- 1165 Posey Ln
- 1160 Posey Ln
- 1174 Posey Ln
- 1173 Posey Ln
- 1145 Posey Ln
- 1180 Posey Ln
- 0 Posey Ln Unit 7403280
- 0 Posey Ln
- 851 Heiferhorn Trace
- 863 Heiferhorn Trace
- 1186 Posey Ln
- 873 Heiferhorn Trace
- 1185 Posey Ln
- 847 Heiferhorn Trace
- 1133 Posey Ln
- 1148 Posey Ln
- 921 Heiferhorn Trace
- 1192 Posey Ln
- 856 Heiferhorn Trace
- 872 Heiferhorn Trace