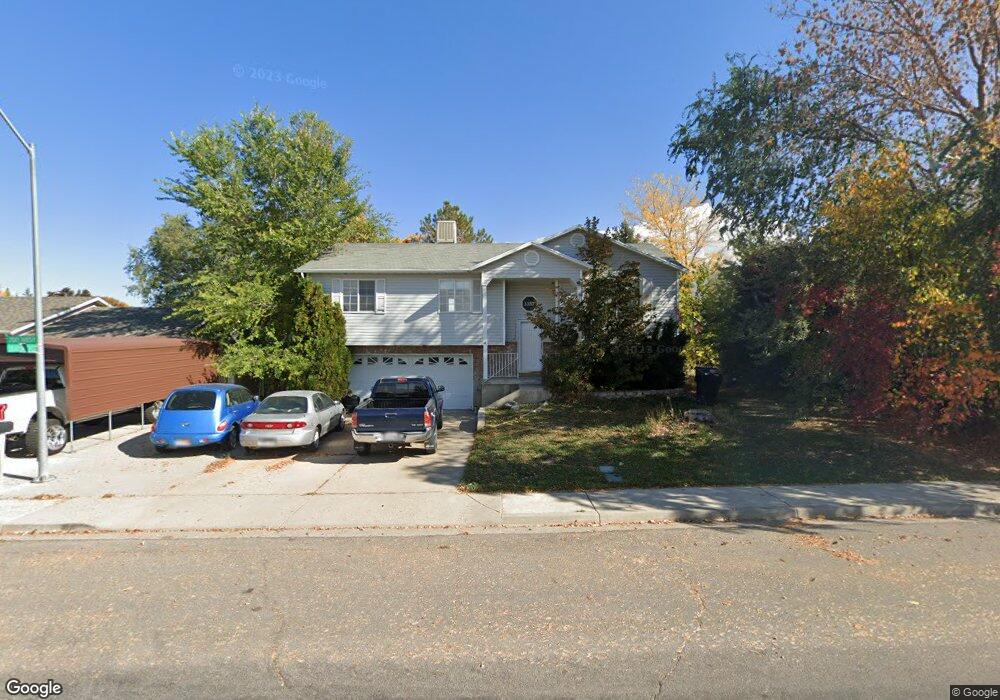
1157 S 780 W Payson, UT 84651
Estimated Value: $458,000 - $487,000
4
Beds
3
Baths
1,901
Sq Ft
$246/Sq Ft
Est. Value
About This Home
This home is located at 1157 S 780 W, Payson, UT 84651 and is currently estimated at $468,075, approximately $246 per square foot. 1157 S 780 W is a home located in Utah County with nearby schools including Wilson Elementary School, Payson Junior High School, and Mt. Nebo Junior High School.
Ownership History
Date
Name
Owned For
Owner Type
Purchase Details
Closed on
Oct 30, 2013
Sold by
Castrellon Antonio and Rodriguez Sebastiana
Bought by
Ethington John and Ethington Flora
Current Estimated Value
Purchase Details
Closed on
Aug 23, 2005
Sold by
Lasalle Bank Na
Bought by
Castrellon Antonio and Rodriguez Sebastiana
Home Financials for this Owner
Home Financials are based on the most recent Mortgage that was taken out on this home.
Original Mortgage
$121,500
Interest Rate
7.12%
Mortgage Type
Stand Alone First
Purchase Details
Closed on
Jun 21, 2005
Sold by
Jones Walter L
Bought by
Lasalle Bank Na
Purchase Details
Closed on
Apr 14, 2003
Sold by
Caron David A and Caron Nancy J
Bought by
Jones Walter L
Create a Home Valuation Report for This Property
The Home Valuation Report is an in-depth analysis detailing your home's value as well as a comparison with similar homes in the area
Home Values in the Area
Average Home Value in this Area
Purchase History
| Date | Buyer | Sale Price | Title Company |
|---|---|---|---|
| Ethington John | -- | None Available | |
| Castrellon Antonio | -- | First Southwestern Title Ag | |
| Lasalle Bank Na | $126,629 | Inwest Title | |
| Jones Walter L | -- | First American Title Co |
Source: Public Records
Mortgage History
| Date | Status | Borrower | Loan Amount |
|---|---|---|---|
| Previous Owner | Castrellon Antonio | $121,500 |
Source: Public Records
Tax History Compared to Growth
Tax History
| Year | Tax Paid | Tax Assessment Tax Assessment Total Assessment is a certain percentage of the fair market value that is determined by local assessors to be the total taxable value of land and additions on the property. | Land | Improvement |
|---|---|---|---|---|
| 2025 | $2,128 | $230,010 | $148,400 | $269,800 |
| 2024 | $2,128 | $216,590 | $0 | $0 |
| 2023 | $2,161 | $220,550 | $0 | $0 |
| 2022 | $2,179 | $218,735 | $0 | $0 |
| 2021 | $1,835 | $295,400 | $97,300 | $198,100 |
| 2020 | $1,715 | $270,100 | $84,600 | $185,500 |
| 2019 | $1,523 | $245,900 | $84,600 | $161,300 |
| 2018 | $1,333 | $207,400 | $65,700 | $141,700 |
| 2017 | $1,210 | $101,255 | $0 | $0 |
| 2016 | $1,164 | $96,800 | $0 | $0 |
| 2015 | $1,136 | $93,830 | $0 | $0 |
| 2014 | $1,022 | $84,975 | $0 | $0 |
Source: Public Records
Map
Nearby Homes
- 1163 S 730 W
- 1087 S 680 W
- 1172 S 880 W
- 1161 Utah 198
- 802 Brookside Ct
- 1128 W 1150 S Unit 9
- 1116 W 1290 S
- 1216 S 1150 W Unit 19
- 588 W 1450 S
- 1002 W Temple Rim Ln
- 1192 W 1130 St S Unit 202
- 598 W Saddlebrook Dr
- 626 S 800 W Unit 32
- 1579 S 910 W
- 610 S 800 W Unit 30
- 1592 S 790 W
- 513 W 600 S
- 533 S 700 W
- 1597 S 1100 W
- 528 S 800 W