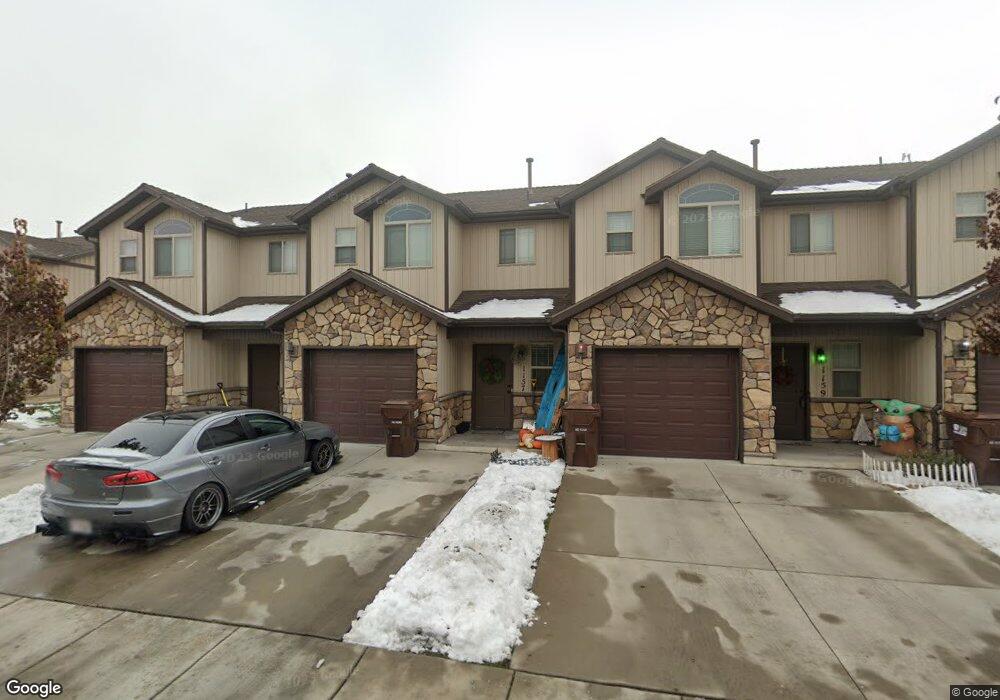
1157 W Lancelot Ln West Haven, UT 84401
Estimated Value: $328,000 - $338,000
3
Beds
3
Baths
1,371
Sq Ft
$243/Sq Ft
Est. Value
About This Home
This home is located at 1157 W Lancelot Ln, West Haven, UT 84401 and is currently estimated at $333,181, approximately $243 per square foot. 1157 W Lancelot Ln is a home located in Weber County with nearby schools including North Park School, Ogden Preparatory Academy, and Davinci Academy.
Ownership History
Date
Name
Owned For
Owner Type
Purchase Details
Closed on
Jun 28, 2018
Sold by
Lundeen Gregory W and Lundeen Patricia A
Bought by
Shields Jordan
Current Estimated Value
Purchase Details
Closed on
Mar 31, 2016
Bought by
Lundeen Gregory
Home Financials for this Owner
Home Financials are based on the most recent Mortgage that was taken out on this home.
Original Mortgage
$111,000
Interest Rate
3.71%
Purchase Details
Closed on
May 7, 2014
Sold by
Poll Jaque Don
Bought by
Cash Danielle
Purchase Details
Closed on
Dec 21, 2009
Sold by
Camelot Cove Llc
Bought by
Poll Jaque Don and Cash Danielle
Home Financials for this Owner
Home Financials are based on the most recent Mortgage that was taken out on this home.
Original Mortgage
$130,099
Interest Rate
4.87%
Mortgage Type
FHA
Create a Home Valuation Report for This Property
The Home Valuation Report is an in-depth analysis detailing your home's value as well as a comparison with similar homes in the area
Home Values in the Area
Average Home Value in this Area
Purchase History
| Date | Buyer | Sale Price | Title Company |
|---|---|---|---|
| Shields Jordan | -- | Hickman Land Title Co | |
| Lundeen Gregory | -- | -- | |
| Cash Danielle | -- | None Available | |
| Poll Jaque Don | -- | Hickman Land Title Company |
Source: Public Records
Mortgage History
| Date | Status | Borrower | Loan Amount |
|---|---|---|---|
| Previous Owner | Lundeen Gregory | $111,000 | |
| Previous Owner | Lundeen Gregory | -- | |
| Previous Owner | Poll Jaque Don | $130,099 |
Source: Public Records
Tax History Compared to Growth
Tax History
| Year | Tax Paid | Tax Assessment Tax Assessment Total Assessment is a certain percentage of the fair market value that is determined by local assessors to be the total taxable value of land and additions on the property. | Land | Improvement |
|---|---|---|---|---|
| 2025 | $1,817 | $327,365 | $80,000 | $247,365 |
| 2024 | $1,738 | $175,450 | $44,000 | $131,450 |
| 2023 | $1,688 | $168,850 | $44,000 | $124,850 |
| 2022 | $1,721 | $176,000 | $44,000 | $132,000 |
| 2021 | $1,373 | $238,000 | $24,000 | $214,000 |
| 2020 | $1,288 | $205,000 | $24,000 | $181,000 |
| 2019 | $1,289 | $194,000 | $24,000 | $170,000 |
| 2018 | $1,104 | $159,000 | $24,000 | $135,000 |
| 2017 | $907 | $127,000 | $22,000 | $105,000 |
| 2016 | $914 | $69,300 | $12,100 | $57,200 |
| 2015 | $875 | $65,450 | $12,100 | $53,350 |
| 2014 | $851 | $62,150 | $12,100 | $50,050 |
Source: Public Records
Map
Nearby Homes
- 1161 W Lancelot Ln
- 1137 Excalibur Way
- 2391 W Arthur Way
- 2010 S 1100 W
- 873 W 25th St
- 769 W 24th St
- 768 W 24th St
- 925 W Ellis St
- 815 W 26th St
- 2067 S 1625 W
- 2355 D Ave
- 2427 D Ave
- 2424 D Ave
- 1170 W 17th St
- 539 W 24th St
- 2444 S Andover St Unit 331
- 2448 S Andover St Unit 333
- 2488 S Andover St
- 2455 Gilmour St
- 1275 S 1200 W
- 1157 W Lancelot Ln
- 1159 W Lancelot Ln
- 1155 W Lancelot Ln
- 1155 W Lancelot Ln
- 1159 W Lancelot Ln
- 1161 W Lancelot Ln
- 1151 W Lancelot Ln
- 1160 W Excalibur Way
- 1163 W Lancelot Ln
- 1163 W Lancelot Ln
- 1151 W Lancelot Ln
- 1156 W Excalibur Way
- 1162 W Excalibur Way
- 1149 W Lancelot Ln
- 1185 W Lancelot Ln
- 1152 W Excalibur Way
- 1147 W Lancelot Ln
- 1147 W Lancelot Ln
- 1166 W Excalibur Way
- 1158 W Lancelot Ln