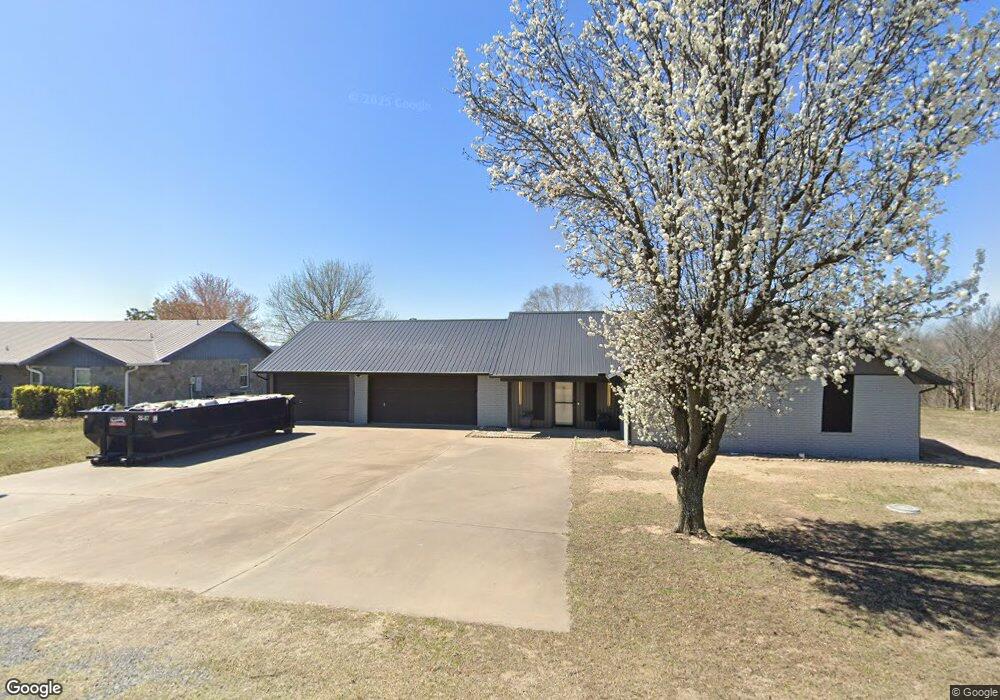
115738 S 4196 Rd Checotah, OK 74426
Estimated Value: $320,608 - $402,000
3
Beds
2
Baths
1,640
Sq Ft
$222/Sq Ft
Est. Value
About This Home
This home is located at 115738 S 4196 Rd, Checotah, OK 74426 and is currently estimated at $363,402, approximately $221 per square foot. 115738 S 4196 Rd is a home located in McIntosh County with nearby schools including Eufaula Elementary School, Eufaula Middle School, and Eufaula High School.
Ownership History
Date
Name
Owned For
Owner Type
Purchase Details
Closed on
Mar 25, 2022
Sold by
Rempe Chad C and Rempe April L
Bought by
Rempe Rentals Llc
Current Estimated Value
Purchase Details
Closed on
Oct 9, 2020
Sold by
Horn Truman M and Horn Sharon M
Bought by
Rempe Chad and Rempe April
Home Financials for this Owner
Home Financials are based on the most recent Mortgage that was taken out on this home.
Original Mortgage
$199,600
Interest Rate
2.9%
Mortgage Type
New Conventional
Purchase Details
Closed on
Oct 16, 2009
Sold by
Dobbins Christopher J and Dobbins Jill M
Bought by
Horn Truman M and Horn Sharron M
Purchase Details
Closed on
Aug 20, 2004
Sold by
Puryear
Bought by
Dobbins
Purchase Details
Closed on
Feb 12, 2001
Sold by
Sterne
Bought by
Puryear
Purchase Details
Closed on
May 5, 2000
Sold by
Kleiss
Bought by
Sterne
Purchase Details
Closed on
Aug 15, 1989
Create a Home Valuation Report for This Property
The Home Valuation Report is an in-depth analysis detailing your home's value as well as a comparison with similar homes in the area
Purchase History
| Date | Buyer | Sale Price | Title Company |
|---|---|---|---|
| Rempe Rentals Llc | -- | None Listed On Document | |
| Rempe Chad | $249,500 | None Available | |
| Horn Truman M | $21,500 | None Available | |
| Dobbins | $132,000 | -- | |
| Puryear | $124,000 | -- | |
| Sterne | $125,500 | -- | |
| -- | $62,500 | -- |
Source: Public Records
Mortgage History
| Date | Status | Borrower | Loan Amount |
|---|---|---|---|
| Previous Owner | Rempe Chad | $199,600 |
Source: Public Records
Tax History
| Year | Tax Paid | Tax Assessment Tax Assessment Total Assessment is a certain percentage of the fair market value that is determined by local assessors to be the total taxable value of land and additions on the property. | Land | Improvement |
|---|---|---|---|---|
| 2025 | $2,767 | $31,611 | $6,490 | $25,121 |
| 2024 | $2,690 | $31,821 | $6,490 | $25,331 |
| 2023 | $2,690 | $29,328 | $6,600 | $22,728 |
| 2022 | $2,317 | $27,932 | $6,600 | $21,332 |
| 2021 | $2,312 | $27,546 | $6,600 | $20,946 |
| 2020 | $1,779 | $21,194 | $3,245 | $17,949 |
| 2019 | $1,795 | $21,194 | $3,245 | $17,949 |
| 2018 | $1,764 | $21,194 | $3,245 | $17,949 |
| 2017 | $1,756 | $21,076 | $3,245 | $17,831 |
| 2016 | $1,604 | $19,167 | $3,245 | $15,922 |
| 2015 | $1,508 | $18,255 | $3,245 | $15,010 |
| 2014 | $1,498 | $18,255 | $3,245 | $15,010 |
Source: Public Records
Map
Nearby Homes
- 115847 S 4197 Rd
- 0 S 4192 Rd Unit 2600774
- 421975 E 1155 Rd
- Tbd E1157
- 0 Lynn Ln Unit 2538038
- 0 Scott Dr
- 0 S 4193 Rd Unit 2537771
- S 4193 Rd
- 5 County
- 419074 E 1156 Rd
- 419907 E 1153 Rd
- 0 4189 Rd Unit 2603018
- 04 Meadowood
- Tbd Checotah
- 420707 E 1166 Rd
- 100 Ns 420
- 100 N 420
- 116307 S 4209 Rd
- 20 Lake View Rd
- 20 S 4207 Rd
- 115738 S 4196 Rd
- 115756 S 4196 Rd
- 1870 W Lake Park Dr
- 115739 S 4196 Rd
- 115797 S 4196 Rd
- 0 S 4196 Rd Unit 1728326
- 0 S 4196 Rd Unit 1827391
- 0 S 4196 Rd Unit 1902496
- 0 S 4196 Rd Unit 1926885
- 0 S 4196 Rd Unit 2001806
- 0 S 4196 Rd Unit 2027373
- 0 S 4196 Rd Unit 2103925
- 115806 S 4197 Rd
- 115672 S 4196 Rd
- 115672 S 4196 Rd
- 115758 S 4197 Rd
- 115823 S 4197 Rd
- 1403 Nottingham Place
- 115803 S 4197 Rd
- 1877 Rr 2
Your Personal Tour Guide
Ask me questions while you tour the home.