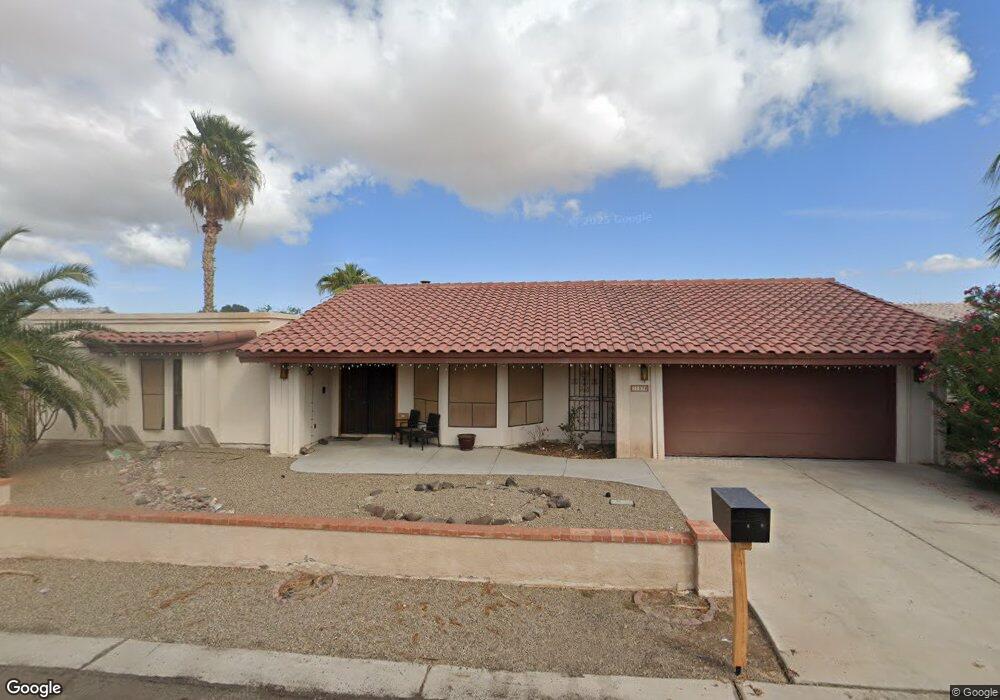
11578 E Via Salida Yuma, AZ 85367
Fortuna Foothills NeighborhoodEstimated Value: $351,000 - $399,000
3
Beds
2
Baths
1,863
Sq Ft
$201/Sq Ft
Est. Value
About This Home
This home is located at 11578 E Via Salida, Yuma, AZ 85367 and is currently estimated at $373,608, approximately $200 per square foot. 11578 E Via Salida is a home located in Yuma County with nearby schools including Sunrise Elementary School, Ron Watson Middle School, and Gila Ridge High School.
Ownership History
Date
Name
Owned For
Owner Type
Purchase Details
Closed on
May 16, 2025
Sold by
Whitehurst Jerry A and Whitehurst Carol A
Bought by
Flood James A
Current Estimated Value
Purchase Details
Closed on
Apr 18, 2023
Sold by
Whitehurst Jerry A and Whitehurst Carol A
Bought by
Whitehurst Jerry A and Whitehurst Carol A
Purchase Details
Closed on
Aug 26, 2022
Sold by
Nora Thompson
Bought by
Whitehurst Jerry A and Whitehurst Carol A
Purchase Details
Closed on
Mar 12, 2019
Sold by
Estes Dixie R
Bought by
Whitehurst Jerry A and Whitehurst Carol A
Purchase Details
Closed on
Apr 22, 2013
Sold by
Horton Julie A and Mullaney Julie A
Bought by
Horton W Allen and Horton Julie A
Purchase Details
Closed on
Apr 12, 2005
Sold by
Mullaney Julie A
Bought by
Mullaney Julie A and Julie A Mullaney Living Trust
Purchase Details
Closed on
Jul 16, 1998
Sold by
Mullaney Donald F and Mullaney Julie A
Bought by
Mullaney Donald F and Mullaney Julie A
Create a Home Valuation Report for This Property
The Home Valuation Report is an in-depth analysis detailing your home's value as well as a comparison with similar homes in the area
Home Values in the Area
Average Home Value in this Area
Purchase History
| Date | Buyer | Sale Price | Title Company |
|---|---|---|---|
| Flood James A | $354,000 | None Listed On Document | |
| Whitehurst Jerry A | -- | None Listed On Document | |
| Whitehurst Jerry A | -- | -- | |
| Whitehurst Jerry A | $170,000 | Chicago Title Agency Inc | |
| Horton W Allen | -- | None Available | |
| Mullaney Julie A | -- | -- | |
| Mullaney Donald F | -- | -- |
Source: Public Records
Tax History Compared to Growth
Tax History
| Year | Tax Paid | Tax Assessment Tax Assessment Total Assessment is a certain percentage of the fair market value that is determined by local assessors to be the total taxable value of land and additions on the property. | Land | Improvement |
|---|---|---|---|---|
| 2025 | $2,333 | $23,034 | $6,094 | $16,940 |
| 2024 | $2,290 | $21,937 | $5,915 | $16,022 |
| 2023 | $2,290 | $20,892 | $5,257 | $15,635 |
| 2022 | $2,215 | $19,897 | $5,913 | $13,984 |
| 2021 | $2,324 | $18,950 | $5,384 | $13,566 |
| 2020 | $1,819 | $18,048 | $5,200 | $12,848 |
| 2019 | $1,793 | $17,220 | $4,943 | $12,277 |
| 2018 | $1,696 | $16,401 | $5,397 | $11,004 |
| 2017 | $1,625 | $16,401 | $5,397 | $11,004 |
| 2016 | $1,672 | $14,875 | $4,530 | $10,345 |
| 2015 | $1,366 | $14,167 | $5,027 | $9,140 |
| 2014 | $1,366 | $13,493 | $3,240 | $10,253 |
Source: Public Records
Map
Nearby Homes
- 10780 S Madero St
- 11676 E Del Golfo
- 10795 S Monterrey Way
- 11753 E Via Canada
- 10646 S Via Salida
- 11626 E 28th Place
- 10755 S Calle Raquel
- 11632 E 28th Place
- 10747 S Calle Raquel
- 10857 S Via Salida
- 10642 S Calle Raquel
- 11874 E Via Loma Vista
- 12172 E Via Loma Vista
- 11586 E 26th Ln
- 11480 E 26th Ln Unit 2
- 11806 E Omega Ln
- 12170 E Paseo Verano
- 10524 S Del Golfo
- 12170 E Del Verde Dr
- 11452 E 34th St
- 11578 E Via Salida
- 11592 E Via Salida
- 11564 E Via Salida
- 11579 E Via Salida
- 11606 E Via Salida
- 11550 E Via Salida
- 11606 E Via Salida
- 11591 E Via Salida
- 11605 E Via Salida
- 11618 E Via Salida
- 11536 E Via Salida
- 11574 E Del Golfo
- 11619 E Via Salida
- 11584 E Del Golfo
- 11560 E Del Golfo
- 11537 E Via Salida
- 11548 E Del Golfo
- 11624 E Via Salida
- 11596 E Del Golfo
- 11522 E Via Salida