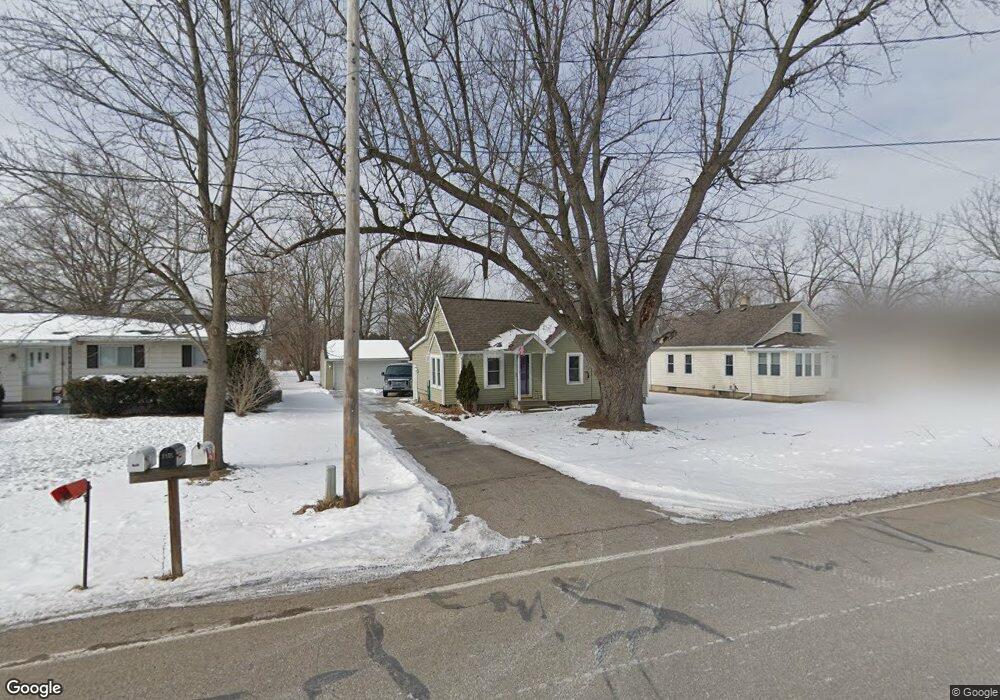
1158 Adams Rd Burton, MI 48509
Estimated Value: $119,000 - $148,037
--
Bed
--
Bath
707
Sq Ft
$195/Sq Ft
Est. Value
About This Home
This home is located at 1158 Adams Rd, Burton, MI 48509 and is currently estimated at $137,759, approximately $194 per square foot. 1158 Adams Rd is a home located in Genesee County with nearby schools including Barhitte Elementary School, Waterbrook Christian Academy, and Genesee Christian School.
Ownership History
Date
Name
Owned For
Owner Type
Purchase Details
Closed on
May 16, 2023
Sold by
Lewis Jeffrey
Bought by
Toutant Mark C and Toutant Marsha K
Current Estimated Value
Home Financials for this Owner
Home Financials are based on the most recent Mortgage that was taken out on this home.
Original Mortgage
$98,200
Outstanding Balance
$95,414
Interest Rate
6.28%
Mortgage Type
New Conventional
Estimated Equity
$42,345
Purchase Details
Closed on
Apr 15, 2003
Sold by
Thorpe Richelle L and Roach Kenneth Reid
Bought by
Lewis Jeffrey
Home Financials for this Owner
Home Financials are based on the most recent Mortgage that was taken out on this home.
Original Mortgage
$88,152
Interest Rate
5.86%
Mortgage Type
FHA
Purchase Details
Closed on
Jan 24, 2001
Sold by
Thorpe Richelle L
Bought by
Roach Kenneth Reid and Thorpe Richelle L
Purchase Details
Closed on
Nov 8, 2000
Sold by
Whitehouse Tamara A and Sampson Tamara A
Bought by
Thorpe Richelle
Create a Home Valuation Report for This Property
The Home Valuation Report is an in-depth analysis detailing your home's value as well as a comparison with similar homes in the area
Home Values in the Area
Average Home Value in this Area
Purchase History
| Date | Buyer | Sale Price | Title Company |
|---|---|---|---|
| Toutant Mark C | $122,750 | None Listed On Document | |
| Lewis Jeffrey | $88,855 | Lawyers Title | |
| Roach Kenneth Reid | -- | -- | |
| Thorpe Richelle | $69,000 | Sargents Title Company |
Source: Public Records
Mortgage History
| Date | Status | Borrower | Loan Amount |
|---|---|---|---|
| Open | Toutant Mark C | $98,200 | |
| Previous Owner | Lewis Jeffrey | $88,152 |
Source: Public Records
Tax History Compared to Growth
Tax History
| Year | Tax Paid | Tax Assessment Tax Assessment Total Assessment is a certain percentage of the fair market value that is determined by local assessors to be the total taxable value of land and additions on the property. | Land | Improvement |
|---|---|---|---|---|
| 2025 | $2,487 | $55,600 | $0 | $0 |
| 2024 | $1,859 | $50,800 | $0 | $0 |
| 2023 | $984 | $42,900 | $0 | $0 |
| 2022 | $889 | $35,900 | $0 | $0 |
| 2021 | $435 | $27,300 | $0 | $0 |
| 2020 | $1,150 | $27,600 | $0 | $0 |
| 2019 | $1,074 | $27,400 | $0 | $0 |
| 2018 | $1,483 | $26,200 | $0 | $0 |
| 2017 | $1,432 | $26,200 | $0 | $0 |
| 2016 | $1,418 | $25,400 | $0 | $0 |
| 2015 | $1,435 | $0 | $0 | $0 |
| 2012 | -- | $19,700 | $19,700 | $0 |
Source: Public Records
Map
Nearby Homes
- 1056 Adams Rd
- 6123 Lapeer Rd
- 1264 Brabbs St
- 1163 S Packard Ave
- 1029 Adams Rd
- 6088 Lapeer Rd
- 1220 S Belsay Rd
- 6149 Roberta St
- 6041 Roberta St
- 1345 Cutler St
- 1.36 Acres E Court St S
- 1413 Martha Ave
- 1450 Transue Ave
- 1147 Rinn St
- 5305 Lapeer Rd
- 5249 Lapeer Rd
- 1380 Audrey St
- 0 Lapeer rd., Burton Lapeer Rd
- 1501 Merle Ave
- 6175 Crabtree Ln