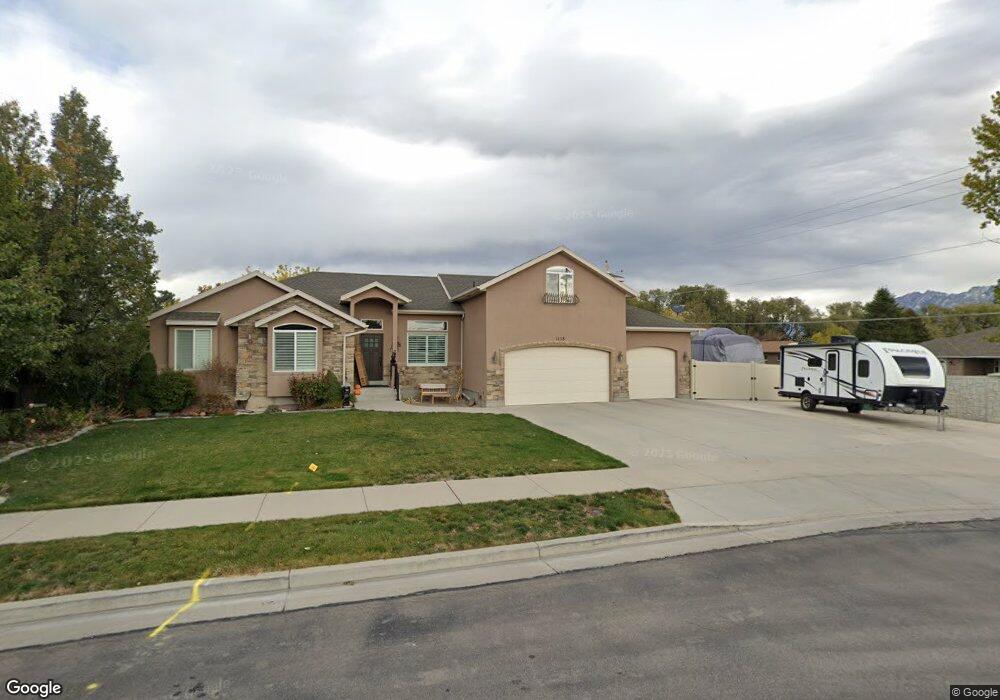
1158 W Michaelsen Way West Jordan, UT 84088
Estimated Value: $673,000 - $872,124
3
Beds
3
Baths
2,175
Sq Ft
$373/Sq Ft
Est. Value
About This Home
This home is located at 1158 W Michaelsen Way, West Jordan, UT 84088 and is currently estimated at $810,781, approximately $372 per square foot. 1158 W Michaelsen Way is a home located in Salt Lake County with nearby schools including Riverside Elementary School, West Jordan Middle School, and West Jordan High School.
Ownership History
Date
Name
Owned For
Owner Type
Purchase Details
Closed on
Sep 11, 2009
Sold by
Constrcution Bryce Hansen
Bought by
Butcher James D and Butcher Adrienne R
Current Estimated Value
Home Financials for this Owner
Home Financials are based on the most recent Mortgage that was taken out on this home.
Original Mortgage
$324,022
Outstanding Balance
$212,017
Interest Rate
5.2%
Mortgage Type
FHA
Estimated Equity
$598,764
Purchase Details
Closed on
Dec 2, 2008
Sold by
Dinkelman Jerry and Dimick Larry
Bought by
Trade West Development Corp
Home Financials for this Owner
Home Financials are based on the most recent Mortgage that was taken out on this home.
Original Mortgage
$264,000
Interest Rate
6.04%
Mortgage Type
Future Advance Clause Open End Mortgage
Purchase Details
Closed on
Sep 23, 2008
Sold by
Trade West Development Corp
Bought by
Dinkelman Jerry and Dimick Larry
Purchase Details
Closed on
Jan 6, 2008
Sold by
Trade West Development Corp
Bought by
Bryce Hansen Construction
Create a Home Valuation Report for This Property
The Home Valuation Report is an in-depth analysis detailing your home's value as well as a comparison with similar homes in the area
Home Values in the Area
Average Home Value in this Area
Purchase History
| Date | Buyer | Sale Price | Title Company |
|---|---|---|---|
| Butcher James D | -- | Integrated Title Ins Service | |
| Trade West Development Corp | -- | Integrated Title Ins Svcs | |
| Dinkelman Jerry | -- | Accommodation | |
| Bryce Hansen Construction | -- | Accommodation |
Source: Public Records
Mortgage History
| Date | Status | Borrower | Loan Amount |
|---|---|---|---|
| Open | Butcher James D | $324,022 | |
| Previous Owner | Trade West Development Corp | $264,000 |
Source: Public Records
Tax History Compared to Growth
Tax History
| Year | Tax Paid | Tax Assessment Tax Assessment Total Assessment is a certain percentage of the fair market value that is determined by local assessors to be the total taxable value of land and additions on the property. | Land | Improvement |
|---|---|---|---|---|
| 2025 | $3,664 | $776,000 | $373,100 | $402,900 |
| 2024 | $3,664 | $691,300 | $363,300 | $328,000 |
| 2023 | $3,664 | $668,500 | $295,600 | $372,900 |
| 2022 | $3,765 | $658,700 | $289,800 | $368,900 |
| 2021 | $3,289 | $522,400 | $232,700 | $289,700 |
| 2020 | $3,114 | $464,100 | $221,600 | $242,500 |
| 2019 | $3,097 | $452,400 | $209,100 | $243,300 |
| 2018 | $2,974 | $430,400 | $209,100 | $221,300 |
| 2017 | $2,742 | $394,500 | $209,100 | $185,400 |
| 2016 | $2,842 | $384,400 | $163,000 | $221,400 |
| 2015 | $2,807 | $369,700 | $173,900 | $195,800 |
| 2014 | $2,693 | $349,000 | $166,100 | $182,900 |
Source: Public Records
Map
Nearby Homes
- 1184 W Michaelsen Way
- 9095 S 1150 W
- 9121 S Hidden Peak Dr
- 9141 S Little Creek Dr
- 9297 S Avignon Place
- 8976 S 1050 W
- 8843 Capernaum Rd
- 8686 S Temple Dr
- 1116 W 9440 S
- 8772 S Midvalley Dr
- 1424 Stone Meadow Dr
- 1352 W 8780 S
- 8713 Mountain Meadow Dr
- 1254 W 8680 S
- 9532 S Willow Trail Way
- 8686 Covewood Place
- 8686 S Temple Dr
- 9332 S Chartres Ave
- 885 W Chartres Ave
- 1633 W Rockaway Ln
- 1168 W Michaelsen Way
- 9090 S 1150 W
- 9085 S 1150 W
- 1167 W Michaelsen Way
- 9078 S 1150 W
- 1184 W Michaelsen Way Unit 214
- 9087 S 1150 W
- 9148 S Michaelsen Way Unit 211
- 9101 S 1150 W
- 1183 W Michaelsen Way
- 9056 S 1150 W
- 1194 W Michaelsen Way
- 9079 S 1150 W
- 1193 W Michaelsen Way Unit 208
- 1182 Trimble Ln
- 1182 W Trimble Ln
- 1141 W Westward Rd Unit 116
- 1122 W Westward Rd Unit 115
- 9050 S 1150 W
- 1202 W Michaelsen Way