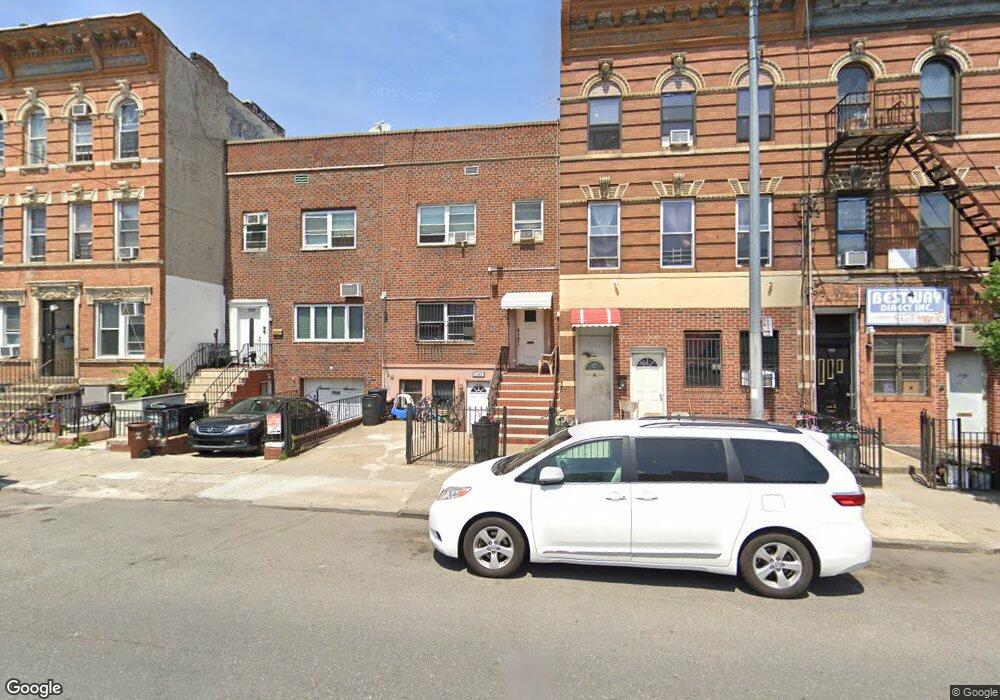
1159 39th St Brooklyn, NY 11218
Borough Park NeighborhoodEstimated Value: $1,496,000 - $2,024,000
--
Bed
--
Bath
2,700
Sq Ft
$618/Sq Ft
Est. Value
About This Home
This home is located at 1159 39th St, Brooklyn, NY 11218 and is currently estimated at $1,667,797, approximately $617 per square foot. 1159 39th St is a home located in Kings County with nearby schools including P.S. 230 Doris L Cohen, I.S. 223 The Montauk, and Franklin Delano Roosevelt High School.
Ownership History
Date
Name
Owned For
Owner Type
Purchase Details
Closed on
Apr 26, 2006
Sold by
Rosenberg William and Zagelbaum Jeffrey
Bought by
Edelstein Chana and Edelstein Joseph
Current Estimated Value
Home Financials for this Owner
Home Financials are based on the most recent Mortgage that was taken out on this home.
Original Mortgage
$75,000
Outstanding Balance
$43,437
Interest Rate
6.4%
Estimated Equity
$1,624,360
Purchase Details
Closed on
Oct 11, 2005
Sold by
Papallo Maria Rosa and Papallo Rocco Giorgio
Bought by
Rosenberg William and Zagelbaum Jeffrey
Home Financials for this Owner
Home Financials are based on the most recent Mortgage that was taken out on this home.
Original Mortgage
$386,000
Interest Rate
5.79%
Mortgage Type
Purchase Money Mortgage
Create a Home Valuation Report for This Property
The Home Valuation Report is an in-depth analysis detailing your home's value as well as a comparison with similar homes in the area
Home Values in the Area
Average Home Value in this Area
Purchase History
| Date | Buyer | Sale Price | Title Company |
|---|---|---|---|
| Edelstein Chana | $750,500 | -- | |
| Edelstein Chana | $750,500 | -- | |
| Rosenberg William | $515,000 | -- | |
| Rosenberg William | $515,000 | -- |
Source: Public Records
Mortgage History
| Date | Status | Borrower | Loan Amount |
|---|---|---|---|
| Open | Edelstein Chana | $75,000 | |
| Closed | Edelstein Chana | $75,000 | |
| Open | Edelstein Chana | $533,850 | |
| Closed | Edelstein Chana | $533,850 | |
| Previous Owner | Rosenberg William | $386,000 |
Source: Public Records
Tax History Compared to Growth
Tax History
| Year | Tax Paid | Tax Assessment Tax Assessment Total Assessment is a certain percentage of the fair market value that is determined by local assessors to be the total taxable value of land and additions on the property. | Land | Improvement |
|---|---|---|---|---|
| 2025 | $7,050 | $85,860 | $23,820 | $62,040 |
| 2024 | $7,050 | $82,080 | $23,820 | $58,260 |
| 2023 | $6,709 | $85,440 | $24,780 | $60,660 |
| 2022 | $6,587 | $68,940 | $24,780 | $44,160 |
| 2021 | $6,896 | $64,080 | $24,780 | $39,300 |
| 2020 | $3,225 | $77,700 | $24,780 | $52,920 |
| 2019 | $6,070 | $85,920 | $24,780 | $61,140 |
| 2018 | $5,552 | $28,696 | $10,725 | $17,971 |
| 2017 | $5,550 | $28,696 | $14,926 | $13,770 |
| 2016 | $5,384 | $28,480 | $17,071 | $11,409 |
| 2015 | $3,045 | $26,868 | $16,058 | $10,810 |
| 2014 | $3,045 | $25,348 | $15,744 | $9,604 |
Source: Public Records
Map
Nearby Homes
- 3809 12th Ave
- 1115 40th St
- 1227 40th St
- 3902 Fort Hamilton Pkwy
- 1243 37th St
- 1271 38th St
- 3545 12th Ave
- 1026 39th St
- 3514 12th Ave
- 4019 10th Ave
- 4103 10th Ave
- 4105 New Utrecht Ave
- 4107 New Utrecht Ave
- 3929 New Utrecht Ave Unit 3A
- 4409 New Utrecht Ave
- 74 Clara St
- 3392 12th Ave
- 27 Church Ave
- 1025 45th St Unit 3F
- 1025 45th St Unit 4D
- 1161 39th St
- 1157 39th St
- 1165 39th St
- 1145 39th St Unit 6
- 1145 39th St Unit 3L
- 1142 38th St
- 1140 38th St
- 1144 38th St
- 1138 38th St
- 3810 12th Ave
- 1136 38th St
- 3808 12th Ave
- 1134 38th St
- 3806 12th Ave
- 1132 38th St
- 3804 12 Ave
- 3804 12th Ave
- 3804 12th Ave Unit 2 B
- 3804 12th Ave Unit 1
- 3804 12th Ave Unit 2R