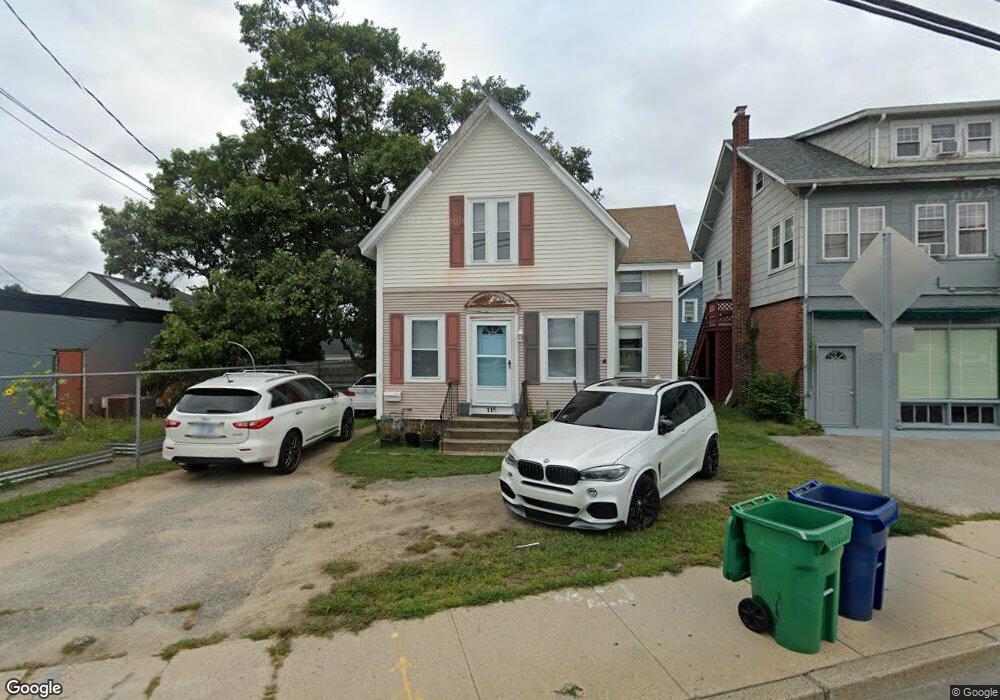
1159 Post Rd Warwick, RI 02888
Norwood NeighborhoodEstimated Value: $269,000 - $369,945
3
Beds
1
Bath
1,669
Sq Ft
$182/Sq Ft
Est. Value
About This Home
This home is located at 1159 Post Rd, Warwick, RI 02888 and is currently estimated at $302,986, approximately $181 per square foot. 1159 Post Rd is a home located in Kent County with nearby schools including St. Peter School and Saint Paul School.
Ownership History
Date
Name
Owned For
Owner Type
Purchase Details
Closed on
Jul 19, 2024
Sold by
Howard W Brynes Ret and Brynes
Bought by
Celtic Roman Grp Llc
Current Estimated Value
Home Financials for this Owner
Home Financials are based on the most recent Mortgage that was taken out on this home.
Original Mortgage
$225,598
Outstanding Balance
$222,066
Interest Rate
6.95%
Mortgage Type
Purchase Money Mortgage
Estimated Equity
$80,920
Purchase Details
Closed on
May 18, 2004
Sold by
Brynes Keith
Bought by
Brynes Howard W
Purchase Details
Closed on
Nov 6, 1997
Sold by
Vendresca Domenick
Bought by
Brynes Keith
Home Financials for this Owner
Home Financials are based on the most recent Mortgage that was taken out on this home.
Original Mortgage
$50,000
Interest Rate
7.19%
Mortgage Type
Purchase Money Mortgage
Create a Home Valuation Report for This Property
The Home Valuation Report is an in-depth analysis detailing your home's value as well as a comparison with similar homes in the area
Home Values in the Area
Average Home Value in this Area
Purchase History
| Date | Buyer | Sale Price | Title Company |
|---|---|---|---|
| Celtic Roman Grp Llc | $225,555 | None Available | |
| Celtic Roman Grp Llc | $225,555 | None Available | |
| Brynes Howard W | $105,000 | -- | |
| Brynes Keith | $70,000 | -- | |
| Brynes Howard W | $105,000 | -- | |
| Brynes Keith | $70,000 | -- |
Source: Public Records
Mortgage History
| Date | Status | Borrower | Loan Amount |
|---|---|---|---|
| Open | Celtic Roman Grp Llc | $225,598 | |
| Closed | Celtic Roman Grp Llc | $225,598 | |
| Previous Owner | Brynes Keith | $50,000 |
Source: Public Records
Tax History
| Year | Tax Paid | Tax Assessment Tax Assessment Total Assessment is a certain percentage of the fair market value that is determined by local assessors to be the total taxable value of land and additions on the property. | Land | Improvement |
|---|---|---|---|---|
| 2025 | $3,247 | $255,700 | $91,100 | $164,600 |
| 2024 | $2,823 | $195,100 | $75,800 | $119,300 |
| 2023 | $2,768 | $195,100 | $75,800 | $119,300 |
| 2022 | $2,615 | $139,600 | $49,400 | $90,200 |
| 2021 | $2,615 | $139,600 | $49,400 | $90,200 |
| 2020 | $2,615 | $139,600 | $49,400 | $90,200 |
| 2019 | $2,615 | $139,600 | $49,400 | $90,200 |
| 2018 | $2,109 | $101,400 | $47,300 | $54,100 |
| 2017 | $2,052 | $101,400 | $47,300 | $54,100 |
| 2016 | $2,052 | $101,400 | $47,300 | $54,100 |
| 2015 | $1,793 | $86,400 | $32,600 | $53,800 |
| 2014 | $1,733 | $86,400 | $32,600 | $53,800 |
| 2013 | $1,647 | $83,200 | $32,600 | $50,600 |
Source: Public Records
Map
Nearby Homes
- 1052 Post Rd
- 175 Pettaconsett Ave
- 27 Frederick St
- 22 Phillips Ave
- 35 Welfare Ave
- 213 Easton Ave
- 821 Post Rd
- 80 George St
- 123 Harrington Ave
- 0 Elmwood Ave
- 39 Holiday Ave
- 15 Christopher Rhodes Way
- 6 Christopher Rhodes Way
- 90 Massachusetts Ave
- 136 Sherwood Ave
- 120 Sherwood Ave
- 63 Benbridge Ave
- 127 Sherwood Ave
- 111 Sherwood Ave
- 171 Sherwood Ave
- 1153 Post Rd
- 1175 Post Rd Unit B
- 271 Welfare Ave
- 396 Norwood Ave
- 265 Welfare Ave
- 390 Norwood Ave
- 1141 Post Rd
- 386 Norwood Ave
- 1181 Post Rd
- 257 Welfare Ave
- 262 Welfare Ave
- 399 Norwood Ave
- 395 Norwood Ave
- 380 Norwood Ave
- 391 Norwood Ave
- 1191 Post Rd
- 251 Welfare Ave
- 127 Majestic Ave
- 376 Norwood Ave
- 385 Norwood Ave
Your Personal Tour Guide
Ask me questions while you tour the home.