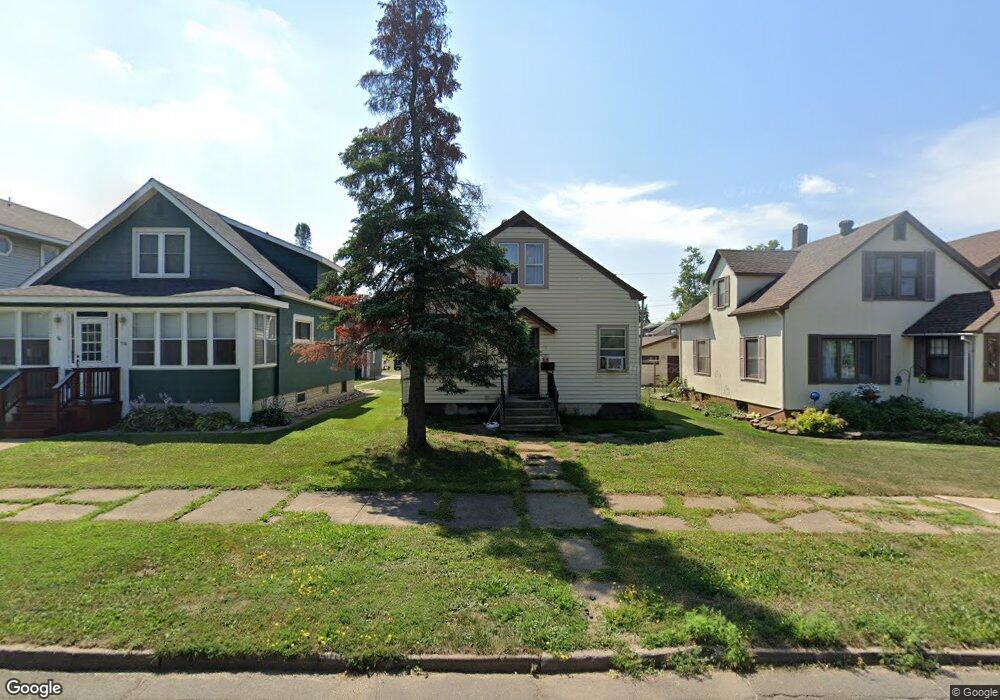
116 10th St S Virginia, MN 55792
Estimated Value: $82,000 - $113,000
2
Beds
1
Bath
1,063
Sq Ft
$90/Sq Ft
Est. Value
About This Home
This home is located at 116 10th St S, Virginia, MN 55792 and is currently estimated at $95,758, approximately $90 per square foot. 116 10th St S is a home located in St. Louis County with nearby schools including Parkview Elementary School, Rock Ridge High School, and Marquette Catholic School.
Ownership History
Date
Name
Owned For
Owner Type
Purchase Details
Closed on
Apr 2, 2024
Sold by
St Louis County Land & Minerals
Bought by
Vanderwilder Investment Group
Current Estimated Value
Purchase Details
Closed on
Aug 11, 2017
Sold by
Vandeventer Terry and Vandeventer Christina
Bought by
Vanderwilder Investment Group
Purchase Details
Closed on
Apr 19, 2013
Sold by
Reil Emilie and Reil Van Deventer
Bought by
Vandeventer Terry
Purchase Details
Closed on
Mar 29, 2004
Sold by
Orazem Mary J and Starcevich Janet
Bought by
Vandeventer Terry and Vandeventer Emilie
Create a Home Valuation Report for This Property
The Home Valuation Report is an in-depth analysis detailing your home's value as well as a comparison with similar homes in the area
Home Values in the Area
Average Home Value in this Area
Purchase History
| Date | Buyer | Sale Price | Title Company |
|---|---|---|---|
| Vanderwilder Investment Group | $5,156 | -- | |
| Vanderwilder Investment Group | $16,363 | None Available | |
| Vandeventer Terry | -- | None Available | |
| Vandeventer Terry | $15,000 | St Louis Co Title Co | |
| Vandeventer Terry | $15,000 | St Louis Co Title Co |
Source: Public Records
Tax History
| Year | Tax Paid | Tax Assessment Tax Assessment Total Assessment is a certain percentage of the fair market value that is determined by local assessors to be the total taxable value of land and additions on the property. | Land | Improvement |
|---|---|---|---|---|
| 2024 | $2,646 | $64,600 | $3,800 | $60,800 |
| 2023 | $2,646 | $64,000 | $3,800 | $60,200 |
| 2022 | $838 | $41,200 | $3,300 | $37,900 |
| 2021 | $828 | $43,700 | $3,300 | $40,400 |
| 2020 | $810 | $37,700 | $3,300 | $34,400 |
| 2019 | $790 | $37,700 | $3,300 | $34,400 |
| 2018 | $786 | $40,300 | $3,000 | $37,300 |
| 2017 | $896 | $40,300 | $3,000 | $37,300 |
| 2016 | $916 | $45,400 | $3,000 | $42,400 |
| 2015 | $298 | $56,000 | $3,000 | $53,000 |
| 2014 | $298 | $33,600 | $1,800 | $31,800 |
Source: Public Records
Map
Nearby Homes
Your Personal Tour Guide
Ask me questions while you tour the home.