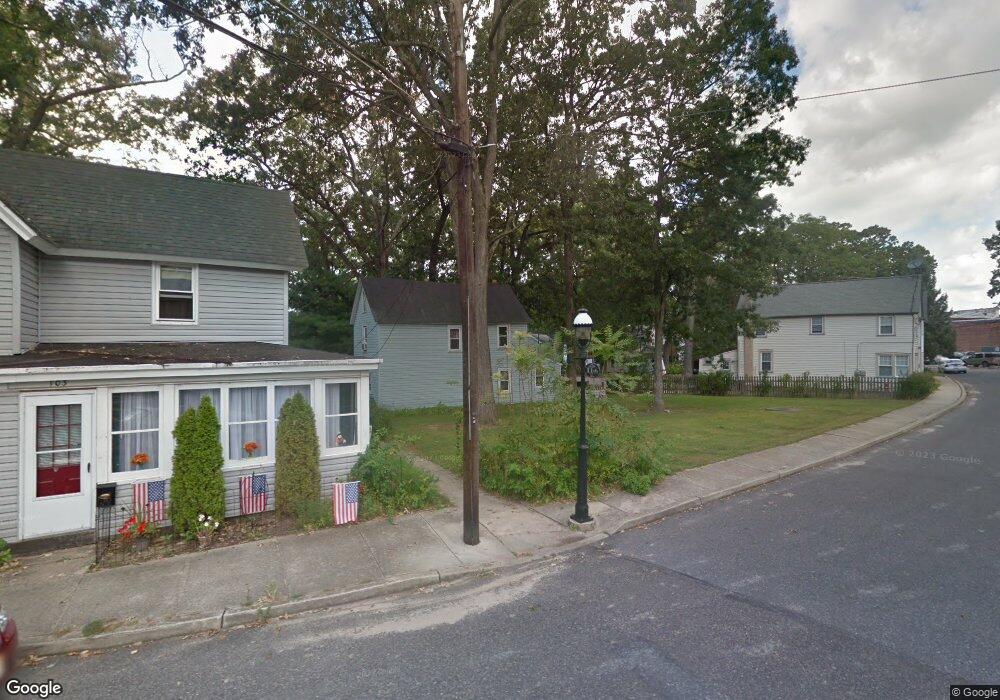
116 11th Ave Pitman, NJ 08071
Estimated Value: $204,461 - $251,000
Studio
--
Bath
864
Sq Ft
$269/Sq Ft
Est. Value
About This Home
This home is located at 116 11th Ave, Pitman, NJ 08071 and is currently estimated at $232,615, approximately $269 per square foot. 116 11th Ave is a home located in Gloucester County with nearby schools including W.C.K. Walls Elementary School, Pitman Middle School, and Pitman High School.
Ownership History
Date
Name
Owned For
Owner Type
Purchase Details
Closed on
Dec 16, 2008
Sold by
Layser Jacqueline J
Bought by
Rosmini Michael A
Current Estimated Value
Home Financials for this Owner
Home Financials are based on the most recent Mortgage that was taken out on this home.
Original Mortgage
$106,200
Outstanding Balance
$70,650
Interest Rate
6.27%
Mortgage Type
Purchase Money Mortgage
Estimated Equity
$161,965
Purchase Details
Closed on
May 8, 2008
Sold by
Layser Fredrick R and Layser Jacqueline J
Bought by
Layser Jacqueline J
Purchase Details
Closed on
Oct 30, 1997
Sold by
Keen Eleanor M
Bought by
Layser Fredrick R and Layser Jacqueline J
Home Financials for this Owner
Home Financials are based on the most recent Mortgage that was taken out on this home.
Original Mortgage
$41,600
Interest Rate
7.26%
Create a Home Valuation Report for This Property
The Home Valuation Report is an in-depth analysis detailing your home's value as well as a comparison with similar homes in the area
Home Values in the Area
Average Home Value in this Area
Purchase History
| Date | Buyer | Sale Price | Title Company |
|---|---|---|---|
| Rosmini Michael A | $118,000 | First Heritage Title Agency | |
| Layser Jacqueline J | -- | None Available | |
| Layser Fredrick R | $52,000 | Congress Title Corp |
Source: Public Records
Mortgage History
| Date | Status | Borrower | Loan Amount |
|---|---|---|---|
| Open | Rosmini Michael A | $106,200 | |
| Previous Owner | Layser Fredrick R | $41,600 |
Source: Public Records
Tax History
| Year | Tax Paid | Tax Assessment Tax Assessment Total Assessment is a certain percentage of the fair market value that is determined by local assessors to be the total taxable value of land and additions on the property. | Land | Improvement |
|---|---|---|---|---|
| 2025 | $4,234 | $121,200 | $24,600 | $96,600 |
| 2024 | $4,122 | $121,200 | $24,600 | $96,600 |
| 2023 | $4,122 | $121,200 | $24,600 | $96,600 |
| 2022 | $3,960 | $121,200 | $24,600 | $96,600 |
| 2021 | $3,322 | $74,100 | $20,300 | $53,800 |
| 2020 | $3,283 | $74,100 | $20,300 | $53,800 |
| 2019 | $3,206 | $74,100 | $20,300 | $53,800 |
| 2018 | $3,045 | $71,600 | $20,300 | $51,300 |
| 2017 | $3,007 | $71,600 | $20,300 | $51,300 |
| 2016 | $2,949 | $71,600 | $20,300 | $51,300 |
| 2015 | $2,870 | $71,600 | $20,300 | $51,300 |
| 2014 | $2,782 | $71,600 | $20,300 | $51,300 |
Source: Public Records
Map
Nearby Homes
- 135 Laurel Ave
- 198 West Ave
- 14 4th Ave
- 127 W Holly Ave
- 349 W Jersey Ave
- 119 121 Grandview Ave
- 407 Tuohy Ave
- 315 Lake Ave
- 412 Alcyon Blvd
- 302 Montgomery Ave
- 508 Lakeview Ave
- 344 Columbia Ave
- 302 Washington Ave
- 205 Adams Ave
- 1040 N Main St
- 508 Hudson Ave
- 103 N Brentwood Ave
- 237 Adams Ave
- 603 Hudson Ave
- 30 N Woodbury Rd
Your Personal Tour Guide
Ask me questions while you tour the home.