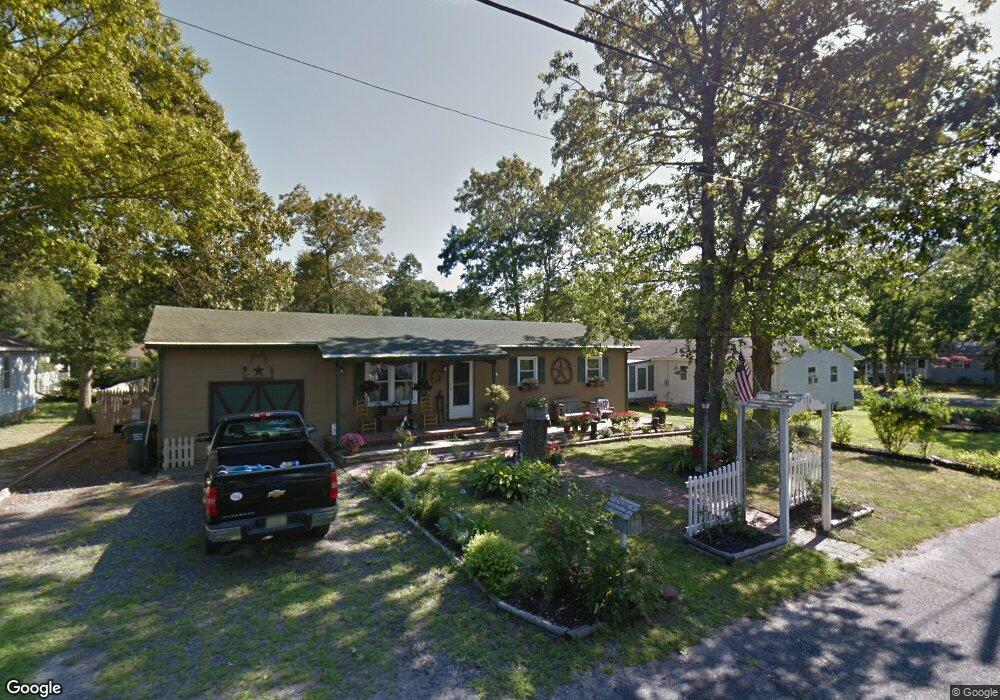
116 2nd Ave Tuckerton, NJ 08087
Estimated Value: $332,000 - $373,000
3
Beds
1
Bath
1,116
Sq Ft
$314/Sq Ft
Est. Value
About This Home
This home is located at 116 2nd Ave, Tuckerton, NJ 08087 and is currently estimated at $350,160, approximately $313 per square foot. 116 2nd Ave is a home located in Ocean County with nearby schools including Tuckerton Elementary School, Pinelands Regional Junior High School, and Pinelands Regional High School.
Ownership History
Date
Name
Owned For
Owner Type
Purchase Details
Closed on
Apr 1, 2013
Sold by
Maresca James A
Bought by
Maresca James A and Shinn Margaret C
Current Estimated Value
Purchase Details
Closed on
Aug 19, 1996
Sold by
Salerno Robert
Bought by
Maresca James
Home Financials for this Owner
Home Financials are based on the most recent Mortgage that was taken out on this home.
Original Mortgage
$75,000
Interest Rate
8.4%
Create a Home Valuation Report for This Property
The Home Valuation Report is an in-depth analysis detailing your home's value as well as a comparison with similar homes in the area
Home Values in the Area
Average Home Value in this Area
Purchase History
| Date | Buyer | Sale Price | Title Company |
|---|---|---|---|
| Maresca James A | $38,840 | None Available | |
| Maresca James | $73,000 | -- |
Source: Public Records
Mortgage History
| Date | Status | Borrower | Loan Amount |
|---|---|---|---|
| Previous Owner | Maresca James | $75,000 |
Source: Public Records
Tax History Compared to Growth
Tax History
| Year | Tax Paid | Tax Assessment Tax Assessment Total Assessment is a certain percentage of the fair market value that is determined by local assessors to be the total taxable value of land and additions on the property. | Land | Improvement |
|---|---|---|---|---|
| 2025 | $4,765 | $153,800 | $53,300 | $100,500 |
| 2024 | $4,340 | $153,800 | $53,300 | $100,500 |
| 2023 | $4,063 | $153,800 | $53,300 | $100,500 |
| 2022 | $4,063 | $153,800 | $53,300 | $100,500 |
| 2021 | $3,991 | $153,800 | $53,300 | $100,500 |
| 2020 | $4,030 | $153,800 | $53,300 | $100,500 |
| 2019 | $4,022 | $153,800 | $53,300 | $100,500 |
| 2018 | $4,184 | $164,000 | $90,000 | $74,000 |
| 2017 | $3,988 | $164,000 | $90,000 | $74,000 |
| 2016 | $3,530 | $164,000 | $90,000 | $74,000 |
| 2015 | $3,484 | $164,000 | $90,000 | $74,000 |
| 2014 | $3,461 | $164,000 | $90,000 | $74,000 |
Source: Public Records
Map
Nearby Homes
- 135 E Main St
- 0 E Main St Unit NJOC2025964
- 0 E Main St Unit 22413983
- 146 Locust St
- 382 Golf View Dr
- 232 S Green St
- 368 Wood St
- 111 Mathis Dr
- 220B Center St
- 133 Giffordtown Ln
- 2 Cypress Ct
- 370 Route 9 S
- 105 Floyd Ln
- 18 Spruce Dr
- 213 Western Ave
- 223 Western Ave
- 7 Gifford Rd
- 1001 County Road 539
- 37 Fairway Dr
- 1 Madeline Ln