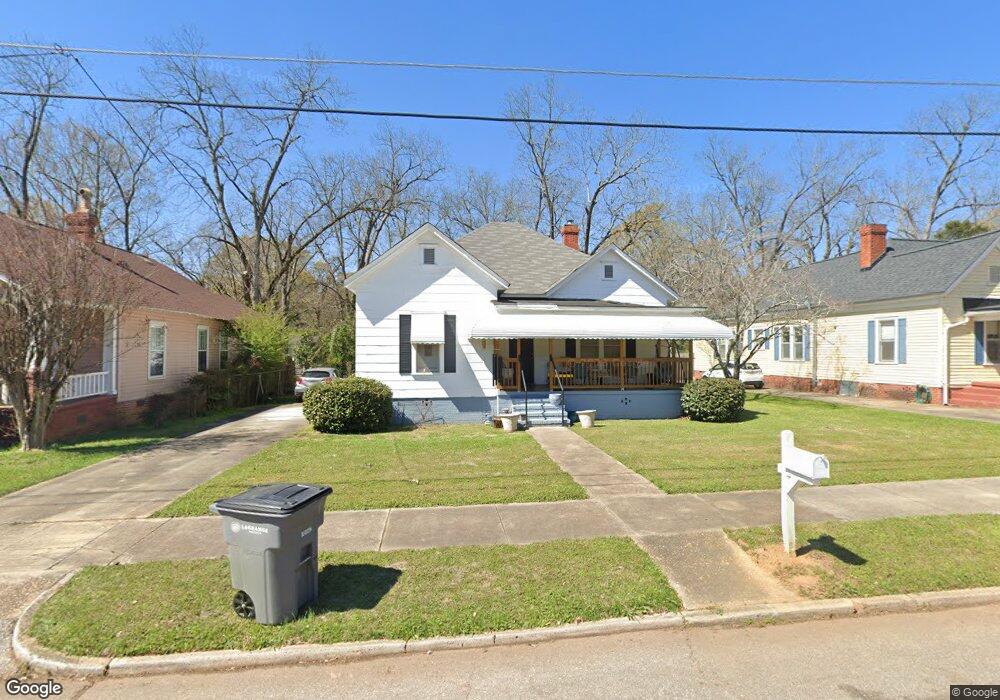
116 Alford St Lagrange, GA 30240
Estimated Value: $164,000 - $186,000
3
Beds
2
Baths
2,023
Sq Ft
$88/Sq Ft
Est. Value
About This Home
This home is located at 116 Alford St, Lagrange, GA 30240 and is currently estimated at $178,608, approximately $88 per square foot. 116 Alford St is a home located in Troup County with nearby schools including Hollis Hand Elementary School, Ethel W. Kight Elementary School, and Franklin Forest Elementary School.
Ownership History
Date
Name
Owned For
Owner Type
Purchase Details
Closed on
Jul 31, 1997
Sold by
Cleary Vicky D
Bought by
Richlan Properties Unl Llc
Current Estimated Value
Purchase Details
Closed on
Jun 29, 1989
Sold by
Newberry Barb and Ann Scott
Bought by
Cleary Vicky D
Purchase Details
Closed on
May 1, 1989
Sold by
Johnson Mildred
Bought by
Newberry Barb and Ann Scott
Purchase Details
Closed on
Oct 1, 1985
Sold by
Jones Bernard Et-Al
Bought by
Johnson Mildred
Purchase Details
Closed on
Apr 5, 1983
Sold by
Jones Jones B and Jones Johnson
Bought by
Jones Bernard Et-Al
Purchase Details
Closed on
Jan 1, 1970
Sold by
Solomon Charles E
Bought by
Jones Jones B and Jones Johnson
Create a Home Valuation Report for This Property
The Home Valuation Report is an in-depth analysis detailing your home's value as well as a comparison with similar homes in the area
Home Values in the Area
Average Home Value in this Area
Purchase History
| Date | Buyer | Sale Price | Title Company |
|---|---|---|---|
| Richlan Properties Unl Llc | $39,500 | -- | |
| Cleary Vicky D | $37,000 | -- | |
| Newberry Barb | -- | -- | |
| Johnson Mildred | -- | -- | |
| Jones Bernard Et-Al | -- | -- | |
| Jones Jones B | -- | -- |
Source: Public Records
Tax History Compared to Growth
Tax History
| Year | Tax Paid | Tax Assessment Tax Assessment Total Assessment is a certain percentage of the fair market value that is determined by local assessors to be the total taxable value of land and additions on the property. | Land | Improvement |
|---|---|---|---|---|
| 2024 | $1,140 | $41,800 | $4,960 | $36,840 |
| 2023 | $1,078 | $39,520 | $4,960 | $34,560 |
| 2022 | $1,048 | $37,560 | $4,960 | $32,600 |
| 2021 | $567 | $18,816 | $4,960 | $13,856 |
| 2020 | $567 | $18,816 | $4,960 | $13,856 |
| 2019 | $472 | $15,660 | $3,960 | $11,700 |
| 2018 | $455 | $15,075 | $3,375 | $11,700 |
| 2017 | $455 | $15,075 | $3,375 | $11,700 |
| 2016 | $461 | $15,270 | $3,375 | $11,895 |
| 2015 | $428 | $15,635 | $3,740 | $11,895 |
| 2014 | $462 | $16,055 | $4,986 | $11,068 |
| 2013 | -- | $16,260 | $4,952 | $11,308 |
Source: Public Records
Map
Nearby Homes
- 209 Boulevard
- 103 Boulevard
- 208 Boulevard
- 500 Boulevard
- 206 Broad St
- 513 Park Ave
- 110 Waverly Way
- 207 Wilkes St
- 505 S Lewis St
- 109 Waverly Way
- 203 Waverly Way
- 509 S Lewis St
- 516 S Lewis St
- 141 Main St
- 105 Saynor Cir
- 410 Gordon St
- 206 Peachtree St
- 217 Jefferson St
- 209 N Lee St
- 0 N Lee St Unit 10550825