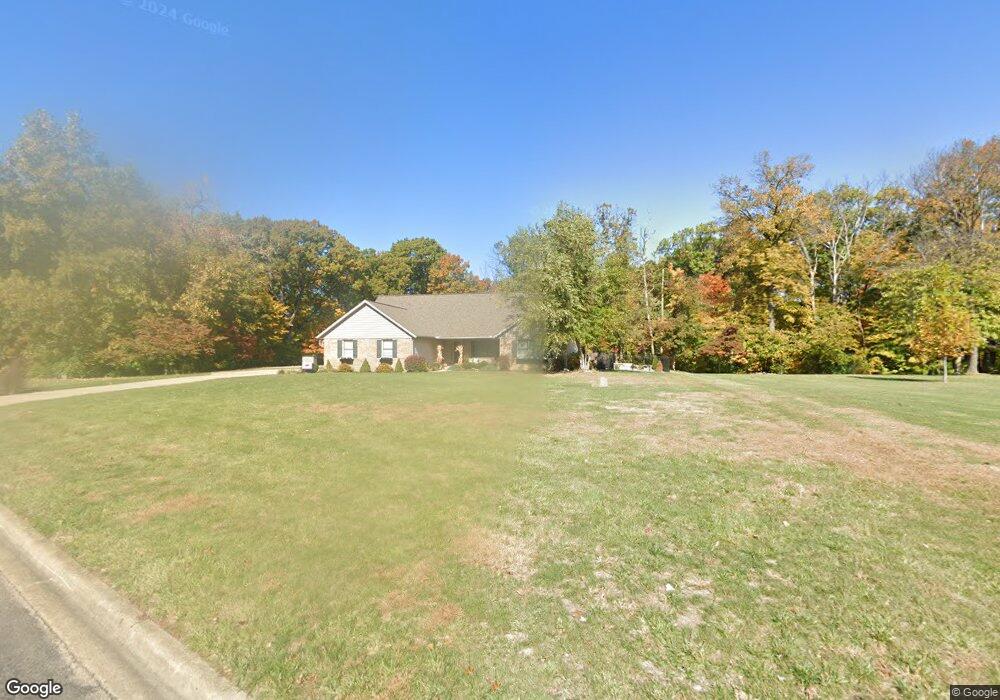
116 Alvatine Ct Washington, IL 61571
Estimated Value: $380,000 - $517,089
4
Beds
4
Baths
2,109
Sq Ft
$208/Sq Ft
Est. Value
About This Home
This home is located at 116 Alvatine Ct, Washington, IL 61571 and is currently estimated at $439,363, approximately $208 per square foot. 116 Alvatine Ct is a home located in Tazewell County with nearby schools including Morton High School.
Ownership History
Date
Name
Owned For
Owner Type
Purchase Details
Closed on
May 27, 2009
Sold by
Schrock Casey and Schrock Dawn
Bought by
Schrock Casey
Current Estimated Value
Home Financials for this Owner
Home Financials are based on the most recent Mortgage that was taken out on this home.
Original Mortgage
$276,350
Outstanding Balance
$176,197
Interest Rate
4.94%
Mortgage Type
New Conventional
Estimated Equity
$263,166
Purchase Details
Closed on
Apr 10, 2006
Sold by
Frye Michael B and Frye Terri M
Bought by
Schrock Casey and Schrock Dawn
Home Financials for this Owner
Home Financials are based on the most recent Mortgage that was taken out on this home.
Original Mortgage
$56,538
Interest Rate
7.5%
Mortgage Type
Purchase Money Mortgage
Purchase Details
Closed on
Mar 15, 2006
Sold by
Wingert David W and Wingert Sheryl R
Bought by
Frye Michael B and Frye Terri M
Home Financials for this Owner
Home Financials are based on the most recent Mortgage that was taken out on this home.
Original Mortgage
$56,538
Interest Rate
7.5%
Mortgage Type
Purchase Money Mortgage
Create a Home Valuation Report for This Property
The Home Valuation Report is an in-depth analysis detailing your home's value as well as a comparison with similar homes in the area
Home Values in the Area
Average Home Value in this Area
Purchase History
| Date | Buyer | Sale Price | Title Company |
|---|---|---|---|
| Schrock Casey | -- | None Available | |
| Schrock Casey | $70,000 | None Available | |
| Frye Michael B | $60,000 | First American Title |
Source: Public Records
Mortgage History
| Date | Status | Borrower | Loan Amount |
|---|---|---|---|
| Open | Schrock Casey | $276,350 | |
| Closed | Schrock Casey | $56,538 | |
| Closed | Frye Michael B | $244,627 |
Source: Public Records
Tax History Compared to Growth
Tax History
| Year | Tax Paid | Tax Assessment Tax Assessment Total Assessment is a certain percentage of the fair market value that is determined by local assessors to be the total taxable value of land and additions on the property. | Land | Improvement |
|---|---|---|---|---|
| 2024 | $8,244 | $133,530 | $30,330 | $103,200 |
| 2023 | $8,244 | $123,880 | $28,140 | $95,740 |
| 2022 | $8,069 | $115,740 | $26,290 | $89,450 |
| 2021 | $7,850 | $106,570 | $25,640 | $80,930 |
| 2020 | $7,682 | $106,570 | $25,640 | $80,930 |
| 2019 | $7,660 | $106,570 | $25,640 | $80,930 |
| 2018 | $7,526 | $106,570 | $25,640 | $80,930 |
| 2017 | $7,334 | $103,580 | $24,920 | $78,660 |
| 2016 | $7,249 | $103,580 | $24,920 | $78,660 |
| 2015 | $7,050 | $0 | $0 | $0 |
| 2013 | $6,942 | $103,580 | $24,920 | $78,660 |
Source: Public Records
Map
Nearby Homes
- 303 Turtle Creek Trail
- 412 Elmhurst Dr
- 209 Racill Ct
- 506 Lotus Ln
- 206 Temple Dr
- 403 Rosewood Dr
- 331 Oakwood Ave
- 101 Patricia Ave
- 607 S Summit Dr
- 3300 E Washington St
- 3304 E Washington St
- 200 & 204 W Forest Ave
- 108 Ursula Ct
- 104 Ursula Ct
- 204 Helene Ct
- 129 E Autumn Ln
- 209 Helene Ct
- 300 Amelia Dr
- 102 Ursula Ct
- 202 Helene Ct
- 120 Alvatine Ct
- 112 Alvatine Ct
- 23305 Farmdale Rd
- 121 Alvatine Ct
- 113 Alvatine Ct
- 23369 Farmdale Rd
- 23245 Farmdale Rd
- 109 Alvatine Ct
- 105 Alvatine Ct
- 101 Alvatine Ct
- 23181 Farmdale Rd
- 104 Dupree Ct
- 148 Camelin Dr
- 152 Camelin Dr
- 23500 Farmdale Rd
- 100 Dupree Ct
- 149 Camelin Dr
- 23215 Farmdale Rd
- 108 Dupree Ct