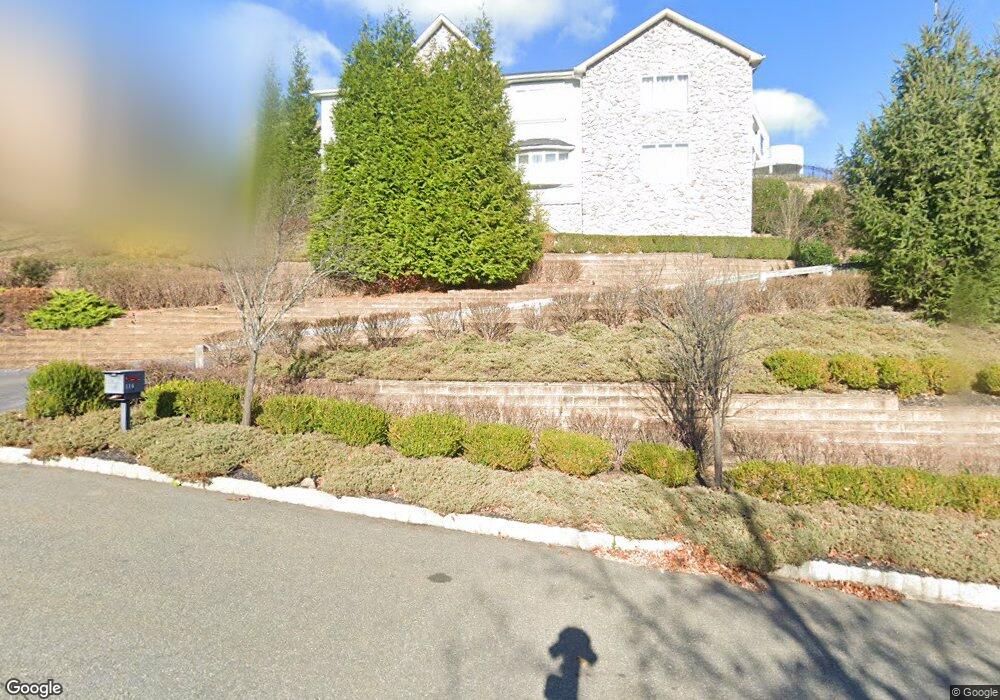
116 Arundel Rd Morris Plains, NJ 07950
Estimated Value: $1,002,000 - $1,325,000
--
Bed
--
Bath
4,246
Sq Ft
$265/Sq Ft
Est. Value
About This Home
This home is located at 116 Arundel Rd, Morris Plains, NJ 07950 and is currently estimated at $1,124,822, approximately $264 per square foot. 116 Arundel Rd is a home with nearby schools including Mount Tabor School, Brooklawn Middle School, and Parsippany Hills High School.
Ownership History
Date
Name
Owned For
Owner Type
Purchase Details
Closed on
Sep 21, 2011
Sold by
Canterbury Estates Inc
Bought by
Chiu Yu Yuan and Lee Yu Ping
Current Estimated Value
Home Financials for this Owner
Home Financials are based on the most recent Mortgage that was taken out on this home.
Original Mortgage
$560,000
Outstanding Balance
$382,383
Interest Rate
4.2%
Mortgage Type
Stand Alone First
Estimated Equity
$742,439
Create a Home Valuation Report for This Property
The Home Valuation Report is an in-depth analysis detailing your home's value as well as a comparison with similar homes in the area
Home Values in the Area
Average Home Value in this Area
Purchase History
| Date | Buyer | Sale Price | Title Company |
|---|---|---|---|
| Chiu Yu Yuan | $700,000 | First American Title Ins Co |
Source: Public Records
Mortgage History
| Date | Status | Borrower | Loan Amount |
|---|---|---|---|
| Open | Chiu Yu Yuan | $560,000 |
Source: Public Records
Tax History Compared to Growth
Tax History
| Year | Tax Paid | Tax Assessment Tax Assessment Total Assessment is a certain percentage of the fair market value that is determined by local assessors to be the total taxable value of land and additions on the property. | Land | Improvement |
|---|---|---|---|---|
| 2025 | $17,825 | $513,100 | $148,900 | $364,200 |
| 2024 | $17,486 | $513,100 | $148,900 | $364,200 |
| 2023 | $17,486 | $513,100 | $148,900 | $364,200 |
| 2022 | $16,270 | $513,100 | $148,900 | $364,200 |
| 2021 | $16,270 | $513,100 | $148,900 | $364,200 |
| 2020 | $15,824 | $513,100 | $148,900 | $364,200 |
| 2019 | $15,398 | $513,100 | $148,900 | $364,200 |
| 2018 | $14,962 | $513,100 | $148,900 | $364,200 |
| 2017 | $14,623 | $513,100 | $148,900 | $364,200 |
| 2016 | $14,372 | $513,100 | $148,900 | $364,200 |
| 2015 | $14,008 | $513,100 | $148,900 | $364,200 |
| 2014 | $13,802 | $513,100 | $148,900 | $364,200 |
Source: Public Records
Map
Nearby Homes