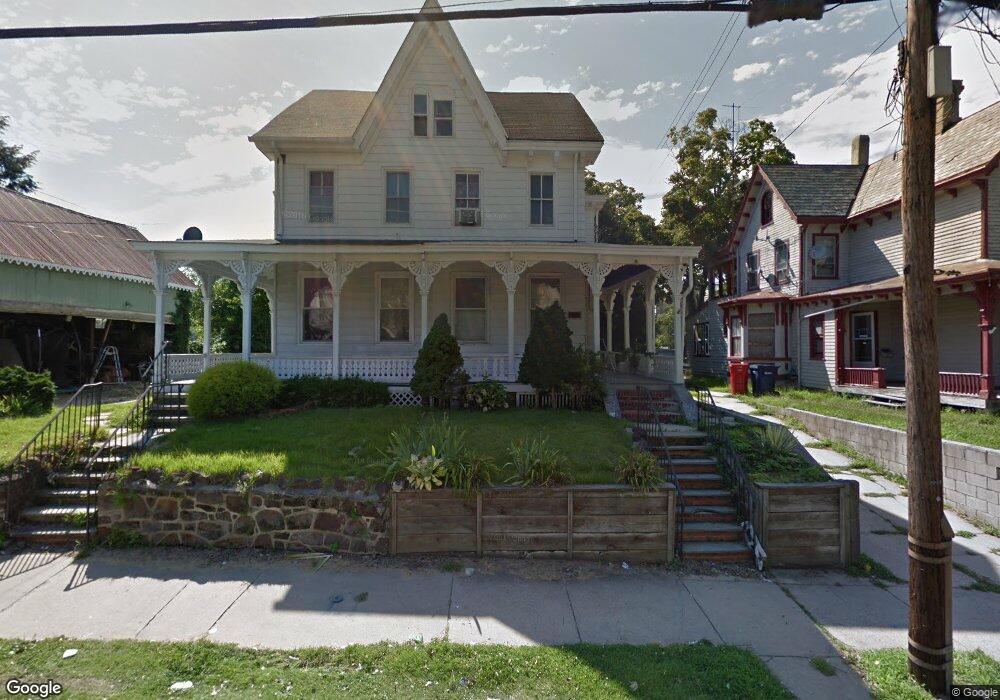
116 Atlantic St Bridgeton, NJ 08302
Estimated Value: $147,000 - $187,000
--
Bed
--
Bath
1,783
Sq Ft
$90/Sq Ft
Est. Value
About This Home
This home is located at 116 Atlantic St, Bridgeton, NJ 08302 and is currently estimated at $161,025, approximately $90 per square foot. 116 Atlantic St is a home located in Cumberland County with nearby schools including Bridgeton High School, Bridgeton Christian School, and Immaculate Conception School.
Ownership History
Date
Name
Owned For
Owner Type
Purchase Details
Closed on
Dec 19, 2016
Sold by
Martinez Sonia
Bought by
Deharo Merced
Current Estimated Value
Purchase Details
Closed on
Jun 26, 2014
Sold by
Deharo Merced
Bought by
Ruelas Maria Ines Lopez and Deharo Maria
Purchase Details
Closed on
Aug 31, 1999
Sold by
Sloboda Franklin D
Bought by
Deharo Merced
Home Financials for this Owner
Home Financials are based on the most recent Mortgage that was taken out on this home.
Original Mortgage
$55,930
Interest Rate
7.65%
Mortgage Type
FHA
Create a Home Valuation Report for This Property
The Home Valuation Report is an in-depth analysis detailing your home's value as well as a comparison with similar homes in the area
Home Values in the Area
Average Home Value in this Area
Purchase History
| Date | Buyer | Sale Price | Title Company |
|---|---|---|---|
| Deharo Merced | -- | None Available | |
| Ruelas Maria Ines Lopez | -- | -- | |
| Deharo Merced | $56,000 | -- |
Source: Public Records
Mortgage History
| Date | Status | Borrower | Loan Amount |
|---|---|---|---|
| Previous Owner | Deharo Merced | $55,930 |
Source: Public Records
Tax History Compared to Growth
Tax History
| Year | Tax Paid | Tax Assessment Tax Assessment Total Assessment is a certain percentage of the fair market value that is determined by local assessors to be the total taxable value of land and additions on the property. | Land | Improvement |
|---|---|---|---|---|
| 2025 | $2,681 | $50,700 | $2,800 | $47,900 |
| 2024 | $2,681 | $50,700 | $2,800 | $47,900 |
| 2023 | $2,573 | $50,700 | $2,800 | $47,900 |
| 2022 | $2,549 | $50,700 | $2,800 | $47,900 |
| 2021 | $2,544 | $50,700 | $2,800 | $47,900 |
| 2020 | $2,527 | $50,700 | $2,800 | $47,900 |
| 2019 | $2,470 | $50,700 | $2,800 | $47,900 |
| 2018 | $2,361 | $50,700 | $2,800 | $47,900 |
| 2017 | $2,293 | $50,700 | $2,800 | $47,900 |
| 2016 | $2,224 | $50,700 | $2,800 | $47,900 |
| 2015 | $2,185 | $50,700 | $2,800 | $47,900 |
| 2014 | $2,436 | $43,000 | $2,400 | $40,600 |
Source: Public Records
Map
Nearby Homes