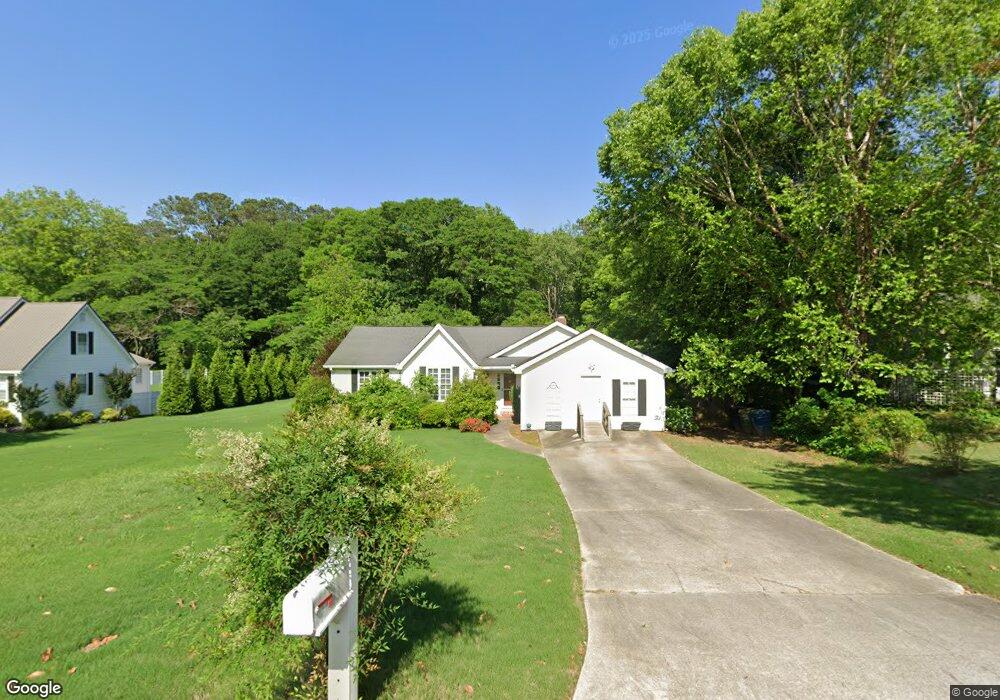
116 Beaver St Carrollton, GA 30117
Estimated Value: $289,000 - $363,000
3
Beds
2
Baths
1,809
Sq Ft
$175/Sq Ft
Est. Value
About This Home
This home is located at 116 Beaver St, Carrollton, GA 30117 and is currently estimated at $316,384, approximately $174 per square foot. 116 Beaver St is a home located in Carroll County with nearby schools including Carrollton Elementary School, Carrollton Upper Elementary School, and Carrollton Middle School.
Ownership History
Date
Name
Owned For
Owner Type
Purchase Details
Closed on
Dec 6, 2013
Sold by
Harden Bob
Bought by
Barden Bob and Harden Patricia D
Current Estimated Value
Home Financials for this Owner
Home Financials are based on the most recent Mortgage that was taken out on this home.
Original Mortgage
$136,000
Outstanding Balance
$101,570
Interest Rate
4.19%
Mortgage Type
New Conventional
Estimated Equity
$214,814
Purchase Details
Closed on
Nov 23, 2005
Sold by
Harden Joseph N
Bought by
Harden Bob
Home Financials for this Owner
Home Financials are based on the most recent Mortgage that was taken out on this home.
Original Mortgage
$145,894
Interest Rate
6.1%
Mortgage Type
New Conventional
Purchase Details
Closed on
Oct 19, 2004
Sold by
Esslinger Vickie T
Bought by
Harden Joseph N
Purchase Details
Closed on
Aug 11, 2003
Sold by
Esslinger William Est
Bought by
Esslinger Vickie T
Purchase Details
Closed on
May 6, 1986
Bought by
Esslionger William
Create a Home Valuation Report for This Property
The Home Valuation Report is an in-depth analysis detailing your home's value as well as a comparison with similar homes in the area
Home Values in the Area
Average Home Value in this Area
Purchase History
| Date | Buyer | Sale Price | Title Company |
|---|---|---|---|
| Barden Bob | -- | -- | |
| Harden Bob | $145,000 | -- | |
| Harden Joseph N | $132,000 | -- | |
| Esslinger Vickie T | -- | -- | |
| Esslionger William | $68,200 | -- |
Source: Public Records
Mortgage History
| Date | Status | Borrower | Loan Amount |
|---|---|---|---|
| Open | Barden Bob | $136,000 | |
| Previous Owner | Harden Bob | $145,894 |
Source: Public Records
Tax History Compared to Growth
Tax History
| Year | Tax Paid | Tax Assessment Tax Assessment Total Assessment is a certain percentage of the fair market value that is determined by local assessors to be the total taxable value of land and additions on the property. | Land | Improvement |
|---|---|---|---|---|
| 2024 | $3,422 | $125,248 | $39,763 | $85,485 |
| 2023 | $3,422 | $118,208 | $39,763 | $78,445 |
| 2022 | $2,696 | $92,374 | $26,509 | $65,865 |
| 2021 | $2,245 | $76,909 | $19,620 | $57,289 |
| 2020 | $2,048 | $70,089 | $19,620 | $50,469 |
| 2019 | $1,937 | $65,674 | $19,620 | $46,054 |
| 2018 | $1,824 | $60,956 | $19,620 | $41,336 |
| 2017 | $1,834 | $60,956 | $19,620 | $41,336 |
| 2016 | $1,844 | $60,956 | $19,620 | $41,336 |
| 2015 | $1,741 | $56,358 | $6,976 | $49,383 |
| 2014 | $1,748 | $56,359 | $6,976 | $49,383 |
Source: Public Records
Map
Nearby Homes
- 105 Haygood Place
- 516 Longview St
- 141 Bowen St
- 142 Griffin Dr
- 117 Orion Terrace
- 308 Old Mill Dr
- 0 Hwy 27 None N
- 98 Millstream Ct
- 219 Broad St
- 166 Maple St
- 74 Old Mill Ct
- 223 Sunset Blvd
- 160 Watson St
- 27 South St
- 1818 Maple St
- 109 S Park St
- 301 Bradley St
- 301 C4 Bradley St
- 423 Clifton Terrace
- 105 Mara St
- 120 Beaver St
- 114 Beaver St
- 120 Beavers St
- 132 Beaver St
- 102 Carter Ave
- 110 Beaver St
- 101 Carter Ave
- 106 Carter Ave
- 225 Ferndale Rd
- 105 Carter Ave
- 702 Longview St
- 650 Longview St
- 110 Carter Ave
- 205 Highland Ave
- 212 Ferndale Rd
- 648 Longview St
- 117 Highland Ave
- 215 Highland Ave
- 36 Beaver St
- 209 Highland Ave