Estimated Value: $303,255 - $347,000
3
Beds
2
Baths
1,603
Sq Ft
$203/Sq Ft
Est. Value
About This Home
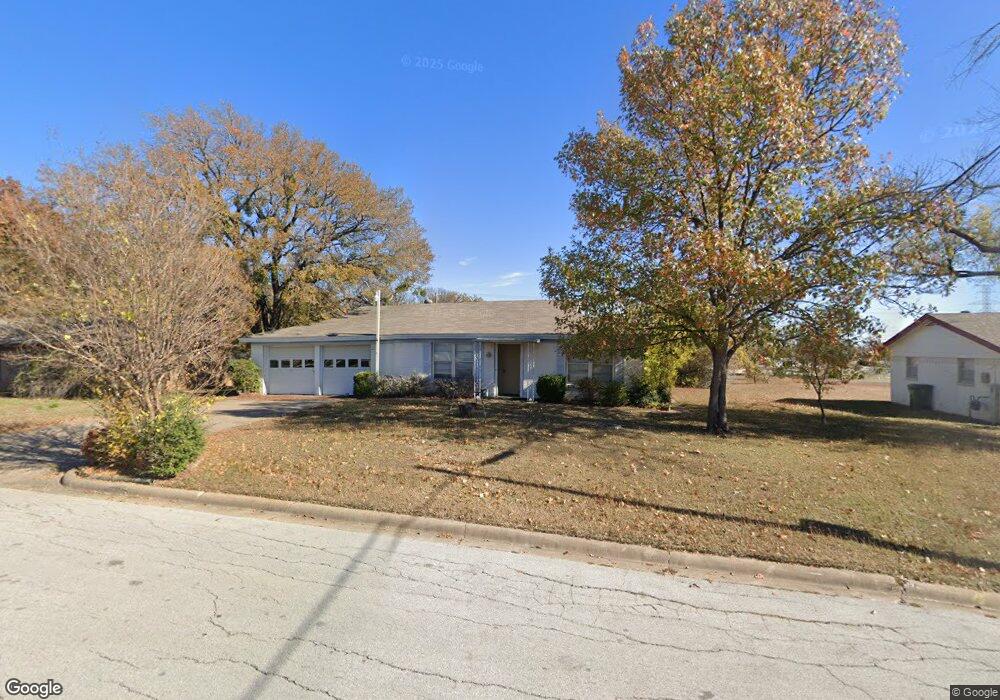
This home is located at 116 Belmont St, Hurst, TX 76053 and is currently estimated at $325,314, approximately $202 per square foot. 116 Belmont St is a home located in Tarrant County with nearby schools including Hurst Hills Elementary School, Hurst J High School, and L.D. Bell High School.
Ownership History
Date
Name
Owned For
Owner Type
Purchase Details
Closed on
Jan 1, 2016
Sold by
Crittenden Nancy and Moore Rebecca Sue
Bought by
Sfon Investments L Lc
Current Estimated Value
Purchase Details
Closed on
Jan 19, 2012
Sold by
Crittenden Floyd W
Bought by
Crittenden Nancy and Moore Rebecca Sue
Purchase Details
Closed on
Dec 1, 2010
Sold by
Crittenden Floyd W
Bought by
Crittenden Nancy and Moore Rebecca Sue
Purchase Details
Closed on
Jan 16, 1996
Sold by
Crittenden Floyd W and Crittenden Orpha B
Bought by
Crittenden Floyd W and Crittenden Orpha B
Purchase Details
Closed on
May 2, 1995
Sold by
Smith George W and Smith Joyce D
Bought by
Crittenden Floyd W and Crittenden Orpha
Purchase Details
Closed on
Aug 23, 1994
Sold by
Crittenden Floyd W and Crittenden Orpha B
Bought by
Crittenden Floyd W and Crittenden Orpha B
Create a Home Valuation Report for This Property
The Home Valuation Report is an in-depth analysis detailing your home's value as well as a comparison with similar homes in the area
Home Values in the Area
Average Home Value in this Area
Purchase History
| Date | Buyer | Sale Price | Title Company |
|---|---|---|---|
| Sfon Investments L Lc | -- | Attorney | |
| Crittenden Nancy | -- | None Available | |
| Crittenden Nancy | -- | None Available | |
| Crittenden Nancy | -- | None Available | |
| Crittenden Floyd W | -- | -- | |
| Crittenden Floyd W | $31,759 | -- | |
| Crittenden Floyd W | -- | -- | |
| Crittenden Floyd W | -- | -- |
Source: Public Records
Tax History Compared to Growth
Tax History
| Year | Tax Paid | Tax Assessment Tax Assessment Total Assessment is a certain percentage of the fair market value that is determined by local assessors to be the total taxable value of land and additions on the property. | Land | Improvement |
|---|---|---|---|---|
| 2025 | $5,097 | $197,000 | $62,225 | $134,775 |
| 2024 | $5,097 | $212,000 | $62,225 | $149,775 |
| 2023 | $5,097 | $254,429 | $51,780 | $202,649 |
| 2022 | $5,411 | $235,000 | $51,728 | $183,272 |
| 2021 | $5,158 | $213,854 | $50,000 | $163,854 |
| 2020 | $4,446 | $184,798 | $50,000 | $134,798 |
| 2019 | $4,685 | $191,411 | $50,000 | $141,411 |
| 2018 | $3,891 | $159,002 | $25,000 | $134,002 |
| 2017 | $3,767 | $148,863 | $25,000 | $123,863 |
| 2016 | $3,608 | $142,593 | $25,000 | $117,593 |
| 2015 | $2,908 | $110,900 | $20,000 | $90,900 |
| 2014 | $2,908 | $110,900 | $20,000 | $90,900 |
Source: Public Records
Map
Nearby Homes
- 228 Arcadia St
- 1200 Walker Dr
- 8308 Fall Crest Dr
- 1112 Blakey Ct
- 8105 Winter Falls Trail
- 8129 Trinity Vista Trail
- 1304 W Redbud Dr
- 1361 Kathryn Ct
- 405 Billy Creek Cir
- 8216 Snow Goose Way
- 632 Melbourne Ct
- 3216 Fountain Pkwy
- 512 Billie Ruth Ln
- 821 Cullum Ct
- 8528 Mystic Trail
- 425 Moore Creek Rd
- 8736 Trinity Vista Trail
- 649 Timberline Dr
- 2954 Volga Ct
- 2967 Danube Ct
- 120 Belmont St
- 112 Belmont St
- 1228 W Hurst Blvd
- 124 Belmont St
- 128 Belmont St
- 125 Belmont St
- 1237 Crestview Dr
- 129 Belmont St
- 1233 Crestview Dr
- 116 Arcadia St
- 120 Arcadia St
- 200 Belmont St
- 124 Arcadia St
- 201 Fanning Dr
- 201 Belmont St
- 128 Arcadia St
- 204 Belmont St
- 1225 Crestview Dr
- 200 Fanning Dr
- 205 Belmont Dr