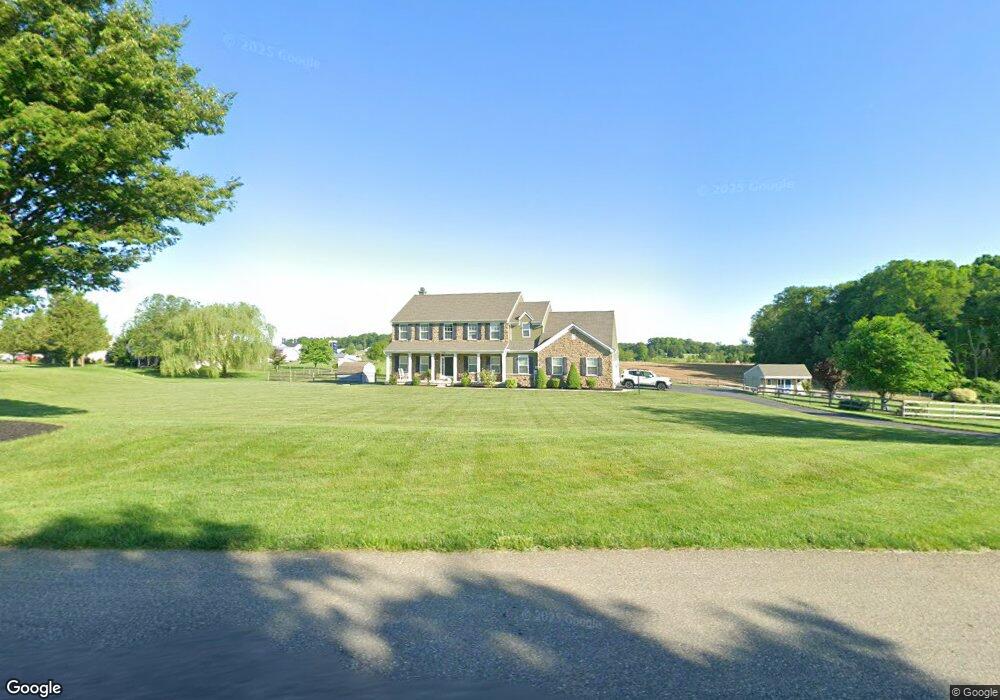
116 Buttercup Dr Unit 112 Oxford, PA 19363
Estimated Value: $637,368 - $688,000
4
Beds
3
Baths
2,963
Sq Ft
$224/Sq Ft
Est. Value
About This Home
This home is located at 116 Buttercup Dr Unit 112, Oxford, PA 19363 and is currently estimated at $663,592, approximately $223 per square foot. 116 Buttercup Dr Unit 112 is a home located in Chester County with nearby schools including Jordan Bank Elementary School, Elk Ridge School, and Nottingham School.
Ownership History
Date
Name
Owned For
Owner Type
Purchase Details
Closed on
Feb 11, 2022
Sold by
Willow Creek Llc
Bought by
Hardy Heather M and Hardy Jonathan K
Current Estimated Value
Home Financials for this Owner
Home Financials are based on the most recent Mortgage that was taken out on this home.
Original Mortgage
$473,318
Outstanding Balance
$439,512
Interest Rate
3.55%
Mortgage Type
FHA
Estimated Equity
$224,080
Purchase Details
Closed on
Aug 18, 2021
Sold by
Sudnicovich William P and Sudnicovich Cynthia A
Bought by
Willow Creek Llc
Purchase Details
Closed on
Sep 8, 2010
Sold by
Willow Creek Llc
Bought by
Sudnikovich William P and Sudnikovich Cynthia A
Home Financials for this Owner
Home Financials are based on the most recent Mortgage that was taken out on this home.
Original Mortgage
$429,450
Interest Rate
4.5%
Mortgage Type
FHA
Purchase Details
Closed on
Nov 12, 2008
Sold by
Hostetter Wilmer L and Hostetter Joyce L
Bought by
Willow Creek Llc
Create a Home Valuation Report for This Property
The Home Valuation Report is an in-depth analysis detailing your home's value as well as a comparison with similar homes in the area
Home Values in the Area
Average Home Value in this Area
Purchase History
| Date | Buyer | Sale Price | Title Company |
|---|---|---|---|
| Hardy Heather M | $494,900 | Penn Transfer Llc | |
| Willow Creek Llc | $438,585 | None Available | |
| Sudnikovich William P | $438,585 | None Available | |
| Willow Creek Llc | $70,000 | None Available |
Source: Public Records
Mortgage History
| Date | Status | Borrower | Loan Amount |
|---|---|---|---|
| Open | Hardy Heather M | $473,318 | |
| Previous Owner | Sudnikovich William P | $429,450 |
Source: Public Records
Tax History Compared to Growth
Tax History
| Year | Tax Paid | Tax Assessment Tax Assessment Total Assessment is a certain percentage of the fair market value that is determined by local assessors to be the total taxable value of land and additions on the property. | Land | Improvement |
|---|---|---|---|---|
| 2025 | $8,985 | $221,250 | $56,920 | $164,330 |
| 2024 | $8,985 | $221,250 | $56,920 | $164,330 |
| 2023 | $8,671 | $221,250 | $56,920 | $164,330 |
| 2022 | $8,368 | $221,250 | $56,920 | $164,330 |
| 2021 | $8,089 | $221,250 | $56,920 | $164,330 |
| 2020 | $7,927 | $221,250 | $56,920 | $164,330 |
| 2019 | $7,858 | $221,250 | $56,920 | $164,330 |
| 2018 | $7,858 | $221,250 | $56,920 | $164,330 |
| 2017 | $7,790 | $221,250 | $56,920 | $164,330 |
| 2016 | $8,190 | $221,250 | $56,920 | $164,330 |
| 2015 | $8,190 | $221,250 | $56,920 | $164,330 |
| 2014 | $8,190 | $221,250 | $56,920 | $164,330 |
Source: Public Records
Map
Nearby Homes
- Wickmere Street #B - Cortland
- 0 Wickmere Street #A - Hemlock Unit PACT2054880
- Wickmere Street #C- Braeburn
- 0 Wickmere Street #F Juniper Unit PACT2063554
- 0 Wickmere Street #E Limerick Unit PACT2063574
- Wickmere Street #D- Fletcher
- Lincolnshire St #D (Waterford)
- 306 Wickmere St Unit 68 QD (FLETCHER)
- 126 Lincolnshire (Waterford) St
- 124 Lincolnshire Street (Greenwich)
- 261 Buckingham St Unit QD 122 (GREENWICH)
- 482 W Christine Rd
- 109 Lincolnshire St
- 0 Lincolnshire St Unit E (BELFAST)
- 0 Lincolnshire St Unit C (GREENWICH)
- 0 Lincolnshire St Unit B (LIMERICK)
- 0 Lincolnshire St Unit A (DUBLIN)
- 103 Lincolnshire St
- 32 Somerset Dr
- 380 Glen Roy Rd
- 116 Buttercup Dr
- 116 Buttercup Dr Unit 12
- 20 Buttercup Dr
- 120 Buttercup Dr
- 168 Granite Dr
- 112 Buttercup Dr
- 117 Buttercup Dr Unit 25
- 117 Buttercup Dr
- 113 Buttercup Dr
- 121 Buttercup Dr
- 164 Granite Dr
- 124 Buttercup Dr
- 109 Buttercup Dr
- 125 Buttercup Dr
- 108 Buttercup Dr
- 149 Granite Dr
- 156 Granite Dr
- 105 Buttercup Dr
- 128 Buttercup Dr
- 160 Granite Dr