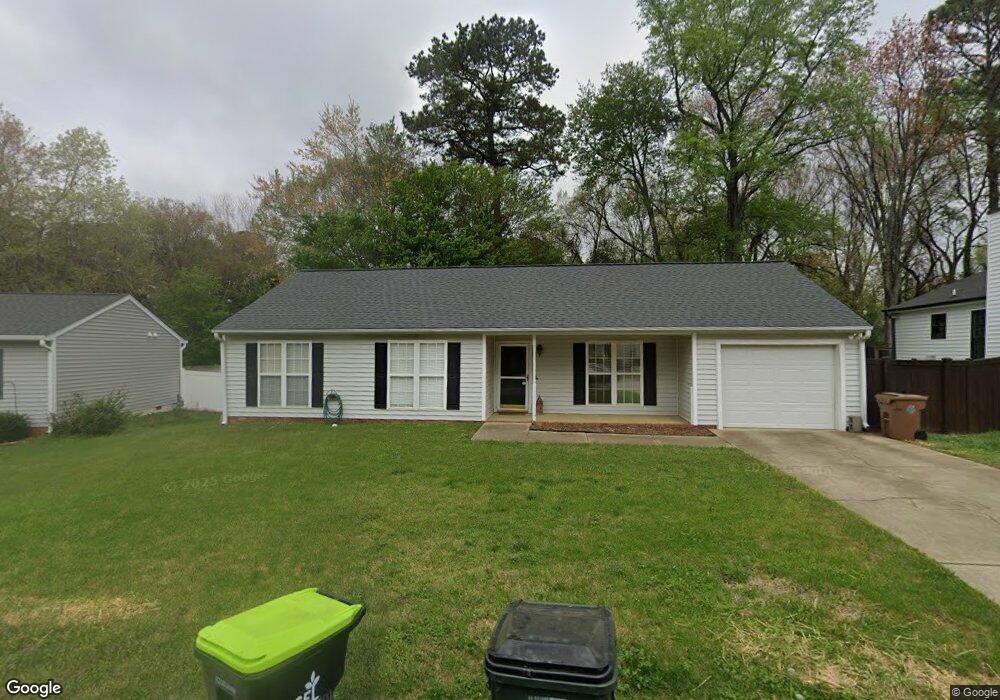
116 Cabrita Ct Holly Springs, NC 27540
Estimated Value: $321,000 - $402,000
3
Beds
2
Baths
1,133
Sq Ft
$313/Sq Ft
Est. Value
About This Home
This home is located at 116 Cabrita Ct, Holly Springs, NC 27540 and is currently estimated at $354,730, approximately $313 per square foot. 116 Cabrita Ct is a home located in Wake County with nearby schools including Holly Springs Elementary School, Holly Ridge Middle School, and Holly Springs High School.
Ownership History
Date
Name
Owned For
Owner Type
Purchase Details
Closed on
Jun 7, 2016
Sold by
Carroll Justin A and Carroll Jessica C
Bought by
Carroll Justin A and Carroll Jessica C
Current Estimated Value
Home Financials for this Owner
Home Financials are based on the most recent Mortgage that was taken out on this home.
Original Mortgage
$65,000
Outstanding Balance
$28,287
Interest Rate
2.89%
Mortgage Type
New Conventional
Estimated Equity
$326,443
Purchase Details
Closed on
Oct 3, 2003
Sold by
Vannest David Vincent and Vannest Kathy
Bought by
Carroll Justin A
Home Financials for this Owner
Home Financials are based on the most recent Mortgage that was taken out on this home.
Original Mortgage
$95,567
Interest Rate
6.28%
Mortgage Type
Seller Take Back
Create a Home Valuation Report for This Property
The Home Valuation Report is an in-depth analysis detailing your home's value as well as a comparison with similar homes in the area
Home Values in the Area
Average Home Value in this Area
Purchase History
| Date | Buyer | Sale Price | Title Company |
|---|---|---|---|
| Carroll Justin A | -- | None Available | |
| Carroll Justin A | $106,500 | -- |
Source: Public Records
Mortgage History
| Date | Status | Borrower | Loan Amount |
|---|---|---|---|
| Open | Carroll Justin A | $65,000 | |
| Closed | Carroll Justin A | $95,567 |
Source: Public Records
Tax History Compared to Growth
Tax History
| Year | Tax Paid | Tax Assessment Tax Assessment Total Assessment is a certain percentage of the fair market value that is determined by local assessors to be the total taxable value of land and additions on the property. | Land | Improvement |
|---|---|---|---|---|
| 2025 | $2,916 | $336,479 | $120,000 | $216,479 |
| 2024 | $2,904 | $336,479 | $120,000 | $216,479 |
| 2023 | $2,175 | $199,788 | $60,000 | $139,788 |
| 2022 | $2,100 | $199,788 | $60,000 | $139,788 |
| 2021 | $2,061 | $199,788 | $60,000 | $139,788 |
| 2020 | $2,061 | $199,788 | $60,000 | $139,788 |
| 2019 | $1,516 | $124,308 | $30,000 | $94,308 |
| 2018 | $1,371 | $124,308 | $30,000 | $94,308 |
| 2017 | $1,322 | $124,308 | $30,000 | $94,308 |
| 2016 | $1,304 | $124,308 | $30,000 | $94,308 |
| 2015 | $1,575 | $148,184 | $44,000 | $104,184 |
| 2014 | $1,421 | $148,184 | $44,000 | $104,184 |
Source: Public Records
Map
Nearby Homes
- 413 Rhamkatte Rd
- 217 Jones Hill Rd
- 208 Old Ride Dr
- 0 Old Ride Dr
- 401 Vista Springs Cir
- 225 Old Ride Dr
- 228 Masden Rd
- 421 Grigsby Ave
- 204 Chrismill Ln
- 321 Blalock St
- 220 Avent Ferry Rd
- 112 Burt St
- 105 Cross Hill Ln
- 144 Holly Mountain Rd
- 124 Cliffdale Rd
- 137 Lacombe Ct
- 720 Starkland Way
- 225 Douglas St
- 109 Lacombe Ct
- 321 Cross Hill Ln
- 112 Cabrita Ct
- 108 Cabrita Ct
- 113 Cabrita Ct
- 412 Holly Springs Rd
- 109 Cabrita Ct
- 104 Cabrita Ct
- 451 Holly Springs Rd
- 105 Cabrita Ct
- 109 Johnson St
- 101 Cabrita Ct
- 100 Cabrita Ct
- 105 Johnson St
- 500 Holly Springs Rd
- 500 Holly Springs Rd Unit 105
- 401 Earp St
- 146 Johnson St
- 315 Earp St
- 409 Earp St
- 409 E Earp St
- 401 E Earp St