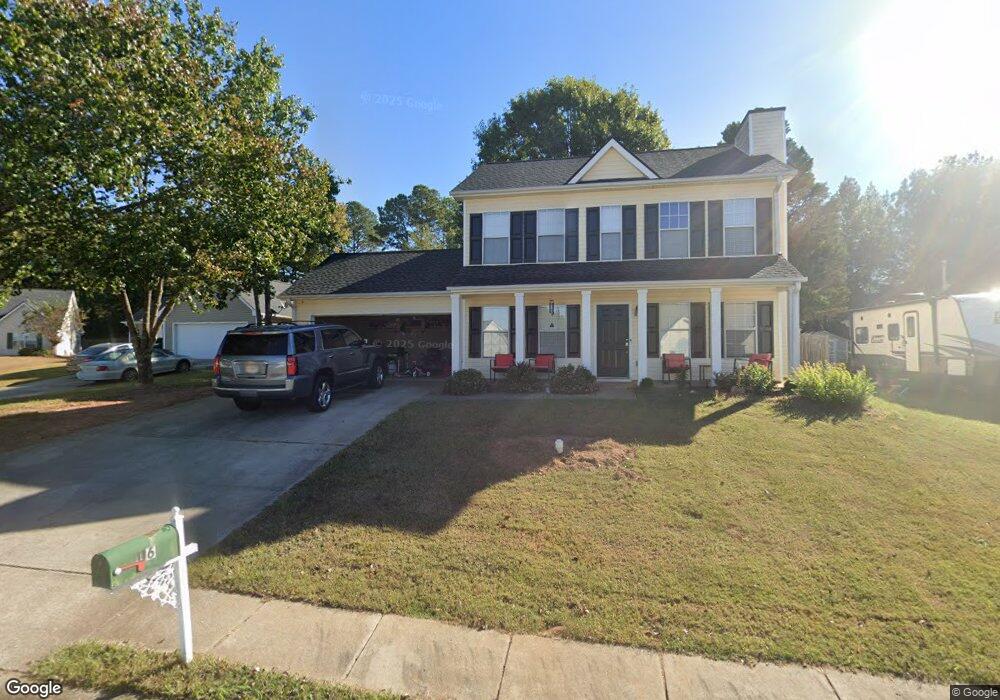
116 Calico Loop Grantville, GA 30220
Estimated Value: $249,000 - $280,000
3
Beds
3
Baths
1,498
Sq Ft
$176/Sq Ft
Est. Value
About This Home
This home is located at 116 Calico Loop, Grantville, GA 30220 and is currently estimated at $263,016, approximately $175 per square foot. 116 Calico Loop is a home located in Coweta County with nearby schools including Glanton Elementary School, Smokey Road Middle School, and Newnan High School.
Ownership History
Date
Name
Owned For
Owner Type
Purchase Details
Closed on
Mar 31, 2016
Sold by
Croft Brandon E
Bought by
Freeze Timothy J
Current Estimated Value
Home Financials for this Owner
Home Financials are based on the most recent Mortgage that was taken out on this home.
Original Mortgage
$116,353
Outstanding Balance
$94,321
Interest Rate
4.4%
Mortgage Type
FHA
Estimated Equity
$168,695
Purchase Details
Closed on
Jun 10, 2003
Sold by
Raptis Homes Inc
Bought by
Croft Brandon E
Home Financials for this Owner
Home Financials are based on the most recent Mortgage that was taken out on this home.
Original Mortgage
$108,850
Interest Rate
5.68%
Mortgage Type
FHA
Purchase Details
Closed on
Oct 23, 2001
Sold by
Glen Grove Development Inc
Bought by
Raptis Homes Inc
Purchase Details
Closed on
Mar 30, 2000
Sold by
Morris Joseph H
Bought by
Glen Grove Development Inc
Create a Home Valuation Report for This Property
The Home Valuation Report is an in-depth analysis detailing your home's value as well as a comparison with similar homes in the area
Purchase History
| Date | Buyer | Sale Price | Title Company |
|---|---|---|---|
| Freeze Timothy J | $118,500 | -- | |
| Croft Brandon E | $109,900 | -- | |
| Raptis Homes Inc | $195,000 | -- | |
| Glen Grove Development Inc | $241,200 | -- |
Source: Public Records
Mortgage History
| Date | Status | Borrower | Loan Amount |
|---|---|---|---|
| Open | Freeze Timothy J | $116,353 | |
| Previous Owner | Croft Brandon E | $108,850 |
Source: Public Records
Tax History
| Year | Tax Paid | Tax Assessment Tax Assessment Total Assessment is a certain percentage of the fair market value that is determined by local assessors to be the total taxable value of land and additions on the property. | Land | Improvement |
|---|---|---|---|---|
| 2025 | $2,543 | $88,304 | $20,000 | $68,304 |
| 2024 | $1,967 | $69,168 | $16,000 | $53,168 |
| 2023 | $1,967 | $69,168 | $16,000 | $53,168 |
Source: Public Records
Map
Nearby Homes
- 128 Calico Loop
- 2 Ray Way
- 121 Bombay Ln
- 128 Bombay Ln
- 309 Lagrange St
- 39 Canterbury Dr
- 24 Chelsea Ln
- 49 Canterbury Dr
- 34 Canterbury Dr
- 75 Canterbury Dr
- 15 Huntington Dr
- 74 Canterbury Dr
- 21 Shepard St
- 00 Bohannon Rd
- 0 Bohannon Rd Unit 24753931
- 0 Bohannon Rd Unit 10398969
- 515 Bohannon Rd Unit 13
- 515 Bohannon Rd
- 260.66 AC Bohannon Rd
- 575 Bohannon Rd
- 114 Calico Loop
- 118 Calico Loop
- 121 Calico Loop
- 112 Calico Loop
- 119 Calico Loop
- 117 Calico Loop
- 122 Calico Loop
- 180 Calico Loop
- 182 Calico Loop
- 115 Calico Loop
- 123 Calico Loop
- 178 Calico Loop
- 124 Calico Loop
- 188 Calico Loop
- 184 Calico Loop
- 110 Calico Loop
- 186 Calico Loop
- 176 Calico Loop
- 113 Calico Loop
- 172 Calico Loop
Your Personal Tour Guide
Ask me questions while you tour the home.