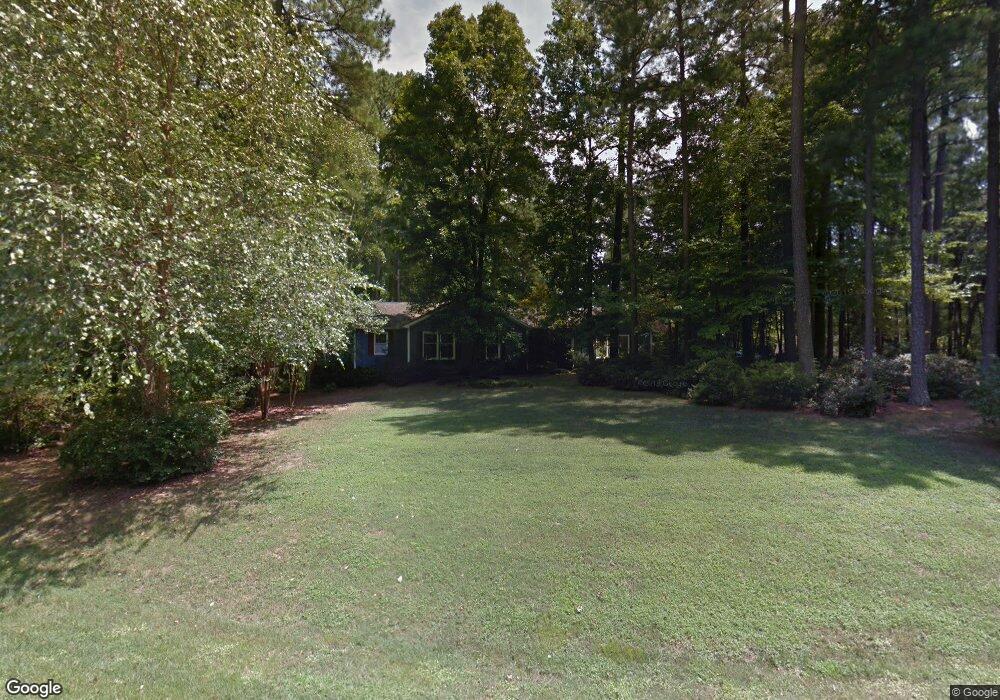
116 Canter Place Durham, NC 27712
North Durham NeighborhoodEstimated Value: $540,000 - $588,000
4
Beds
3
Baths
2,416
Sq Ft
$234/Sq Ft
Est. Value
About This Home
This home is located at 116 Canter Place, Durham, NC 27712 and is currently estimated at $565,620, approximately $234 per square foot. 116 Canter Place is a home located in Durham County with nearby schools including Eno Valley Elementary, George L Carrington Middle, and Northern High School.
Ownership History
Date
Name
Owned For
Owner Type
Purchase Details
Closed on
Jun 25, 2003
Sold by
Veasey Zachary B and Veasey Jill P
Bought by
Lynch Earl C and Lynch Anita C
Current Estimated Value
Home Financials for this Owner
Home Financials are based on the most recent Mortgage that was taken out on this home.
Original Mortgage
$100,000
Outstanding Balance
$14,599
Interest Rate
3%
Mortgage Type
Purchase Money Mortgage
Estimated Equity
$551,021
Create a Home Valuation Report for This Property
The Home Valuation Report is an in-depth analysis detailing your home's value as well as a comparison with similar homes in the area
Home Values in the Area
Average Home Value in this Area
Purchase History
| Date | Buyer | Sale Price | Title Company |
|---|---|---|---|
| Lynch Earl C | $250,000 | -- |
Source: Public Records
Mortgage History
| Date | Status | Borrower | Loan Amount |
|---|---|---|---|
| Open | Lynch Earl C | $100,000 |
Source: Public Records
Tax History
| Year | Tax Paid | Tax Assessment Tax Assessment Total Assessment is a certain percentage of the fair market value that is determined by local assessors to be the total taxable value of land and additions on the property. | Land | Improvement |
|---|---|---|---|---|
| 2025 | $3,480 | $495,710 | $132,160 | $363,550 |
| 2024 | $1,358 | $338,458 | $62,550 | $275,908 |
| 2023 | $3,203 | $338,458 | $62,550 | $275,908 |
| 2022 | $3,081 | $338,458 | $62,550 | $275,908 |
| 2021 | $2,868 | $338,458 | $62,550 | $275,908 |
| 2020 | $2,809 | $338,458 | $62,550 | $275,908 |
| 2019 | $2,809 | $338,458 | $62,550 | $275,908 |
| 2018 | $2,507 | $280,579 | $50,080 | $230,499 |
| 2017 | $2,479 | $280,579 | $50,080 | $230,499 |
| 2016 | $2,374 | $280,579 | $50,080 | $230,499 |
| 2015 | $2,445 | $256,356 | $53,600 | $202,756 |
| 2014 | $2,445 | $256,356 | $53,600 | $202,756 |
Source: Public Records
Map
Nearby Homes
- 12 Crail Ct
- 5807 Craig Rd
- 6 Horizon Cir
- 6208 Craig Rd
- 134 Eagles Nest Dr
- 109 November Dr
- 111 November Dr
- 5120 Raintree Rd
- 316 Continental Dr
- 2222 Umstead Rd
- 6501 Deerview Trail
- 5803 Lillie Dr
- 1011 Umstead Rd
- 1013 Umstead Rd
- 9 Otters Run
- 6101 Bent Oak Dr
- 3103 Broomsedge Way
- 1113 Umstead Grove Way
- 6782 Calais Dr
- 204 Accura Ct
- 120 Canter Place
- 108 Canter Place
- 113 Canter Place
- 2712 Saddle Dr
- 126 Muirfield Ct
- 119 Canter Place
- 117 Canter Place
- 122 Muirfield Ct
- 2734 Saddle Dr
- 121 Canter Place
- 2710 Saddle Dr
- 116 Muirfield Ct
- 130 Muirfield Ct
- 112 Muirfield Ct
- 2706 Saddle Dr
- 2721 Saddle Dr
- 0 Muirfield Ct
- 2739 Saddle Dr
- 5502 Craig Rd
- 129 Muirfield Ct
Your Personal Tour Guide
Ask me questions while you tour the home.