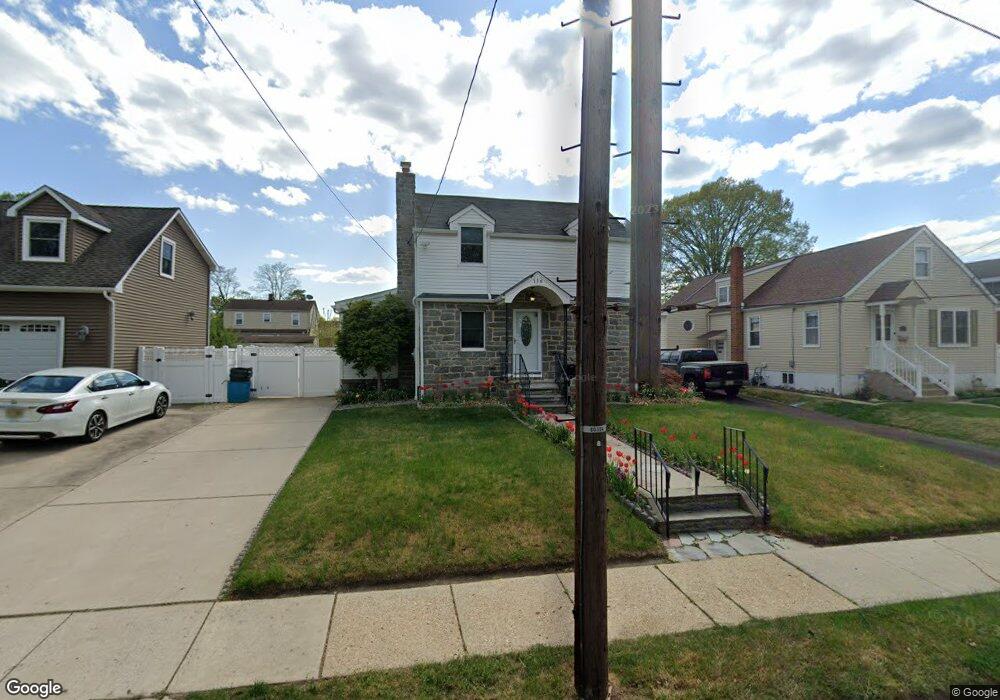
116 Cedar Ave Westville, NJ 08093
Estimated Value: $246,177 - $281,000
2
Beds
1
Bath
1,012
Sq Ft
$260/Sq Ft
Est. Value
About This Home
This home is located at 116 Cedar Ave, Westville, NJ 08093 and is currently estimated at $262,794, approximately $259 per square foot. 116 Cedar Ave is a home located in Gloucester County with nearby schools including Parkview Elementary School and Gateway Regional High School.
Ownership History
Date
Name
Owned For
Owner Type
Purchase Details
Closed on
Jun 23, 2010
Sold by
White John G
Bought by
Olejarski Matthew J
Current Estimated Value
Home Financials for this Owner
Home Financials are based on the most recent Mortgage that was taken out on this home.
Original Mortgage
$139,383
Interest Rate
5.37%
Mortgage Type
FHA
Purchase Details
Closed on
Aug 14, 1995
Sold by
Lewis Stanley G and Mccleish Harry
Bought by
White John G
Create a Home Valuation Report for This Property
The Home Valuation Report is an in-depth analysis detailing your home's value as well as a comparison with similar homes in the area
Purchase History
| Date | Buyer | Sale Price | Title Company |
|---|---|---|---|
| Olejarski Matthew J | $130,000 | None Available | |
| White John G | $70,000 | Continental Title Abstract |
Source: Public Records
Mortgage History
| Date | Status | Borrower | Loan Amount |
|---|---|---|---|
| Previous Owner | Olejarski Matthew J | $139,383 |
Source: Public Records
Tax History
| Year | Tax Paid | Tax Assessment Tax Assessment Total Assessment is a certain percentage of the fair market value that is determined by local assessors to be the total taxable value of land and additions on the property. | Land | Improvement |
|---|---|---|---|---|
| 2025 | $7,090 | $130,300 | $35,500 | $94,800 |
| 2024 | $6,863 | $130,300 | $35,500 | $94,800 |
| 2023 | $6,863 | $130,300 | $35,500 | $94,800 |
| 2022 | $6,666 | $130,300 | $35,500 | $94,800 |
| 2021 | $6,311 | $130,300 | $35,500 | $94,800 |
| 2020 | $6,348 | $130,300 | $35,500 | $94,800 |
| 2019 | $6,181 | $130,300 | $35,500 | $94,800 |
| 2018 | $5,914 | $130,300 | $35,500 | $94,800 |
| 2017 | $6,075 | $130,300 | $35,500 | $94,800 |
| 2016 | $5,874 | $130,300 | $35,500 | $94,800 |
| 2015 | $5,611 | $130,300 | $35,500 | $94,800 |
| 2014 | $4,924 | $132,500 | $36,900 | $95,600 |
Source: Public Records
Map
Nearby Homes
Your Personal Tour Guide
Ask me questions while you tour the home.